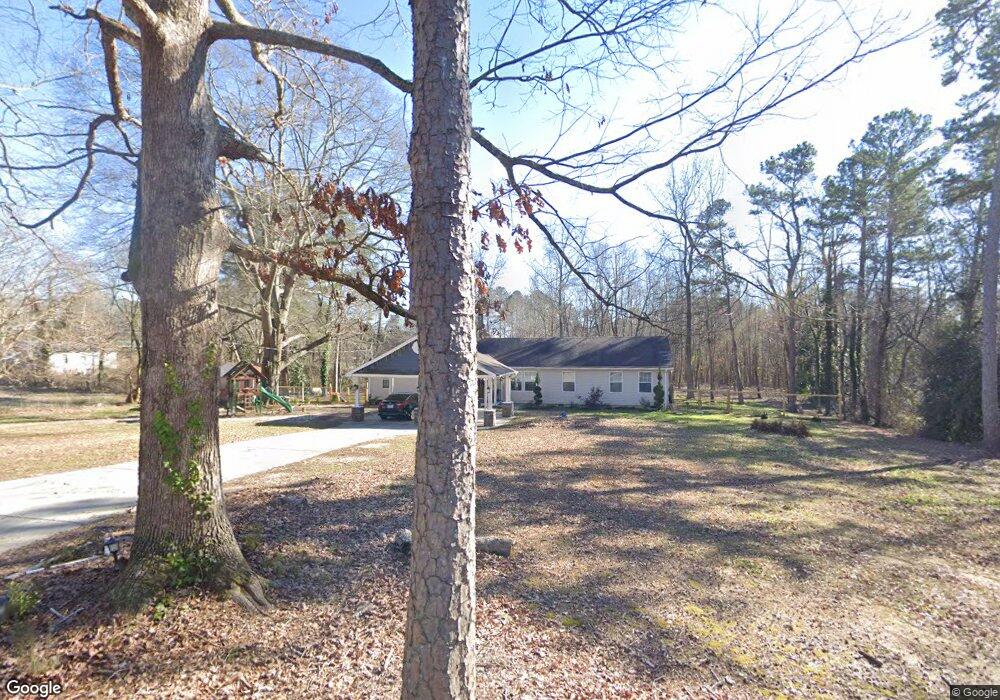
3944 Aycock Dr Lithia Springs, GA 30122
Lithia Springs NeighborhoodEstimated Value: $236,000 - $301,000
4
Beds
2
Baths
2,052
Sq Ft
$138/Sq Ft
Est. Value
About This Home
This home is located at 3944 Aycock Dr, Lithia Springs, GA 30122 and is currently estimated at $283,584, approximately $138 per square foot. 3944 Aycock Dr is a home located in Douglas County with nearby schools including Lithia Springs Elementary School, Turner Middle School, and Lithia Springs Comprehensive High School.
Ownership History
Date
Name
Owned For
Owner Type
Purchase Details
Closed on
Jul 30, 2012
Sold by
Gavina Clemencia Nohemi
Bought by
Gavina Gavina Clemencia Nohemi Clemencia Nohemi and Gavina Vera Jorge
Current Estimated Value
Purchase Details
Closed on
Aug 15, 2011
Sold by
The Bank Of New York Mello
Bought by
Gavina Clemencia Nohemi
Purchase Details
Closed on
May 3, 2011
Sold by
Beckwith Shirley A
Bought by
Bank Of Ny Mellon Series 2006-
Purchase Details
Closed on
May 2, 2005
Sold by
Turner Lula M
Bought by
Beckwith Shirley
Home Financials for this Owner
Home Financials are based on the most recent Mortgage that was taken out on this home.
Original Mortgage
$157,000
Interest Rate
6.21%
Create a Home Valuation Report for This Property
The Home Valuation Report is an in-depth analysis detailing your home's value as well as a comparison with similar homes in the area
Home Values in the Area
Average Home Value in this Area
Purchase History
| Date | Buyer | Sale Price | Title Company |
|---|---|---|---|
| Gavina Gavina Clemencia Nohemi Clemencia Nohemi | -- | -- | |
| Gavina Clemencia Nohemi | $34,000 | -- | |
| Bank Of Ny Mellon Series 2006- | $92,000 | -- | |
| Beckwith Shirley | $40,000 | -- |
Source: Public Records
Mortgage History
| Date | Status | Borrower | Loan Amount |
|---|---|---|---|
| Previous Owner | Beckwith Shirley | $157,000 |
Source: Public Records
Tax History Compared to Growth
Tax History
| Year | Tax Paid | Tax Assessment Tax Assessment Total Assessment is a certain percentage of the fair market value that is determined by local assessors to be the total taxable value of land and additions on the property. | Land | Improvement |
|---|---|---|---|---|
| 2024 | $2,654 | $116,400 | $14,000 | $102,400 |
| 2023 | $2,654 | $116,400 | $14,000 | $102,400 |
| 2022 | $1,801 | $69,440 | $8,000 | $61,440 |
| 2021 | $1,555 | $57,000 | $8,000 | $49,000 |
| 2020 | $1,586 | $57,000 | $8,000 | $49,000 |
| 2019 | $1,484 | $55,720 | $8,000 | $47,720 |
| 2018 | $1,463 | $54,320 | $8,000 | $46,320 |
| 2017 | $1,370 | $48,840 | $8,000 | $40,840 |
| 2016 | $1,281 | $43,600 | $7,440 | $36,160 |
| 2015 | $1,214 | $42,200 | $7,440 | $34,760 |
| 2014 | $1,214 | $39,480 | $7,440 | $32,040 |
| 2013 | -- | $37,760 | $7,440 | $30,320 |
Source: Public Records
Map
Nearby Homes
- 6739 Kull Dr
- 0 Miller St Unit 10574225
- 6717 S Sweetwater Rd
- 3916 S Martin Way
- 6538 N Sweetwater Rd
- 11041 Veterans Memorial Hwy
- 7104 Miller St
- 2530 Rosehill Cir
- 6531 Temple St
- 3476 Cooper St
- 4361 Ben Hill Rd
- 3017 Bellingham Way
- 6277 N Sweetwater Rd
- 6660 Maxwell Dr
- 4385 Donegal Cir
- 7146 Old Beulah Rd
- 4336 Parkview Dr
- 2102 Orchid Ln
- 0 Mckown Rd Unit 7632191
- 0 Mckown Rd Unit 10583796
- 6753 County Line Rd
- 6771 County Line Rd
- 6753 N County Line Rd
- 3966 Aycock Dr
- 6741 County Line Rd
- 6739 County Line Rd
- 6795 County Line Rd
- 3961 Aycock Dr
- 6711 County Line Rd
- 6738 County Line Rd
- 3889 Whitaker Ln
- 6701 County Line Rd
- 6701 County Line Rd
- 6805 County Line Rd
- 6805 N County Line Rd
- 6708 County Line Rd
- 3890 Whitaker Ln
- 6819 County Line Rd
- 6693 County Line Rd
- 3869 Whitaker Ln