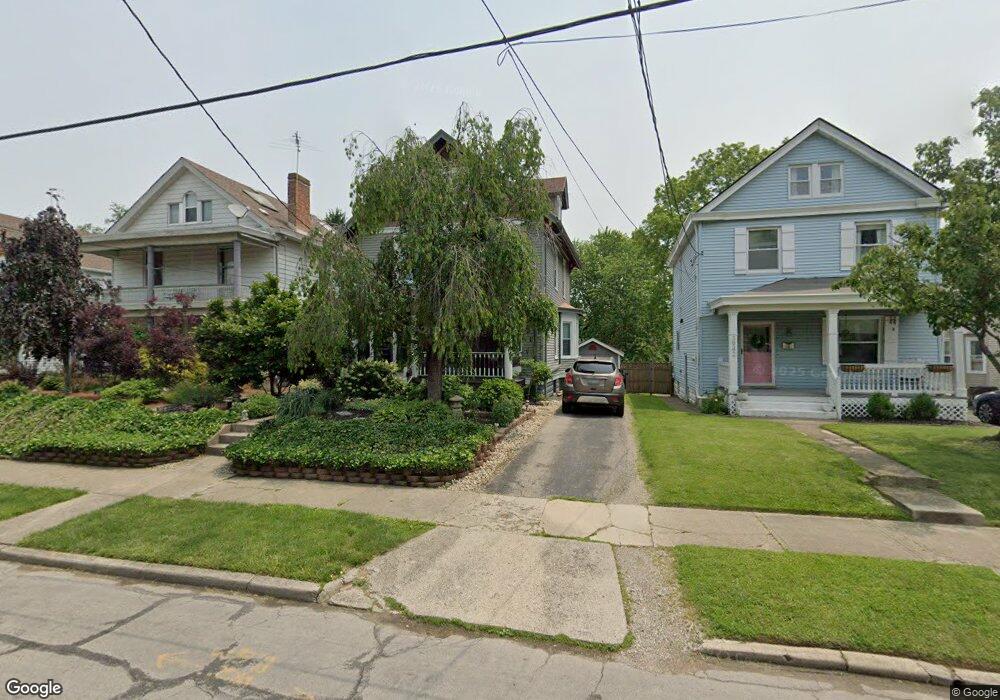
3944 Elsmere Ave Cincinnati, OH 45212
Estimated Value: $318,009 - $438,000
4
Beds
1
Bath
1,802
Sq Ft
$204/Sq Ft
Est. Value
About This Home
This home is located at 3944 Elsmere Ave, Cincinnati, OH 45212 and is currently estimated at $368,252, approximately $204 per square foot. 3944 Elsmere Ave is a home located in Hamilton County with nearby schools including Norwood High School, Cornerstone Christian Academy, and Immaculate Conception Academy.
Ownership History
Date
Name
Owned For
Owner Type
Purchase Details
Closed on
Jan 25, 2002
Sold by
Sickinger Steve
Bought by
Sickinger Steve and Combs Sickinger Jeanne M
Current Estimated Value
Purchase Details
Closed on
Jan 30, 2001
Sold by
Martinez Mel
Bought by
Sickinger Steven
Home Financials for this Owner
Home Financials are based on the most recent Mortgage that was taken out on this home.
Original Mortgage
$85,500
Outstanding Balance
$29,529
Interest Rate
7.18%
Estimated Equity
$338,723
Purchase Details
Closed on
Jul 13, 2000
Sold by
Gardner Douglas C and Gardner Jane
Bought by
Hud
Purchase Details
Closed on
Dec 12, 1996
Sold by
Firestone Richard B and Firestone Maureen Mclaughlin
Bought by
Gardner Douglas C
Home Financials for this Owner
Home Financials are based on the most recent Mortgage that was taken out on this home.
Original Mortgage
$104,700
Interest Rate
7.74%
Mortgage Type
FHA
Create a Home Valuation Report for This Property
The Home Valuation Report is an in-depth analysis detailing your home's value as well as a comparison with similar homes in the area
Home Values in the Area
Average Home Value in this Area
Purchase History
| Date | Buyer | Sale Price | Title Company |
|---|---|---|---|
| Sickinger Steve | -- | -- | |
| Sickinger Steve | -- | -- | |
| Sickinger Steven | -- | Contract Processing & Title | |
| Hud | $74,000 | -- | |
| Gardner Douglas C | $105,000 | -- |
Source: Public Records
Mortgage History
| Date | Status | Borrower | Loan Amount |
|---|---|---|---|
| Open | Sickinger Steven | $85,500 | |
| Previous Owner | Gardner Douglas C | $104,700 |
Source: Public Records
Tax History
| Year | Tax Paid | Tax Assessment Tax Assessment Total Assessment is a certain percentage of the fair market value that is determined by local assessors to be the total taxable value of land and additions on the property. | Land | Improvement |
|---|---|---|---|---|
| 2025 | $4,212 | $81,372 | $26,117 | $55,255 |
| 2023 | $4,202 | $81,372 | $26,117 | $55,255 |
| 2022 | $3,460 | $56,252 | $11,844 | $44,408 |
| 2021 | $3,363 | $56,252 | $11,844 | $44,408 |
| 2020 | $3,371 | $56,252 | $11,844 | $44,408 |
| 2019 | $3,199 | $49,343 | $10,388 | $38,955 |
| 2018 | $3,203 | $49,343 | $10,388 | $38,955 |
| 2017 | $3,021 | $49,343 | $10,388 | $38,955 |
| 2016 | $3,080 | $48,559 | $10,388 | $38,171 |
| 2015 | $2,744 | $48,559 | $10,388 | $38,171 |
| 2014 | $2,738 | $48,559 | $10,388 | $38,171 |
| 2013 | $2,709 | $48,559 | $10,388 | $38,171 |
Source: Public Records
Map
Nearby Homes
- 3950 Elsmere Ave
- 2241 Cameron Ave
- 4108 Montgomery Rd
- 4206 Lafayette Ave
- 4026 Burwood Ave
- 3756 Regent Ave
- 1949 Hudson Ave
- 3766 Floral Ave
- 1931 Waverly Ave
- 2010 Hopkins Ave
- 2557 Shanmoor Ave
- 2223 Madison Ave
- 4010 S Jefferson Ave
- 3933 Grove Ave
- 1820 Wayland Ave
- 3635 Barberry Ave
- 1839 Hopkins Ave
- 3629 Evanston Ave
- 3628 Bevis Ave
- 3764 Grovedale Place
- 3942 Elsmere Ave
- 3948 Elsmere Ave
- 3940 Elsmere Ave
- 3934 Elsmere Ave
- 3954 Elsmere Ave
- 3943 Hazel Ave
- 3947 Hazel Ave
- 3930 Elsmere Ave
- 3937 Hazel Ave
- 3951 Hazel Ave
- 3958 Elsmere Ave
- 3935 Hazel Ave
- 3955 Hazel Ave
- 3947 Elsmere Ave
- 3926 Elsmere Ave
- 3939 Elsmere Ave
- 3955 Elsmere Ave Unit 3
- 3955 Elsmere Ave Unit 2
- 3955 Elsmere Ave Unit 1
- 3951 Elsmere Ave
Your Personal Tour Guide
Ask me questions while you tour the home.