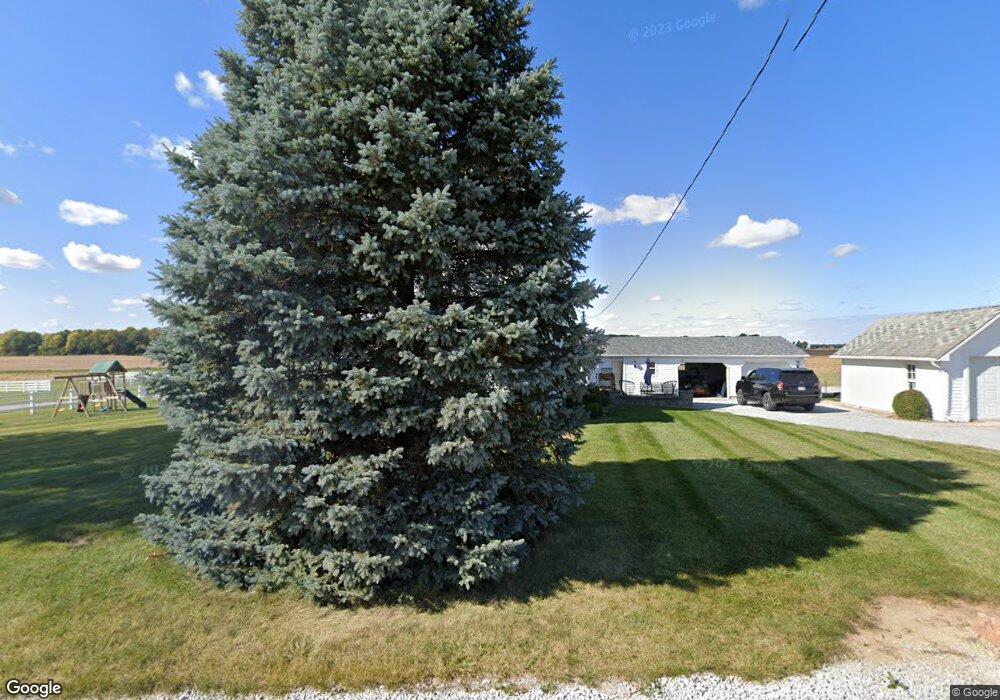
3944 S 400 E Monticello, IN 47960
Estimated Value: $318,251 - $411,000
4
Beds
1
Bath
2,484
Sq Ft
$150/Sq Ft
Est. Value
About This Home
This home is located at 3944 S 400 E, Monticello, IN 47960 and is currently estimated at $373,313, approximately $150 per square foot. 3944 S 400 E is a home located in White County with nearby schools including Twin Lakes Senior High School.
Ownership History
Date
Name
Owned For
Owner Type
Purchase Details
Closed on
Oct 12, 2017
Sold by
Wasson Adam L and Wasson Erica M
Bought by
Buschman Amy N
Current Estimated Value
Home Financials for this Owner
Home Financials are based on the most recent Mortgage that was taken out on this home.
Original Mortgage
$213,750
Outstanding Balance
$176,177
Interest Rate
3.78%
Mortgage Type
New Conventional
Estimated Equity
$197,136
Purchase Details
Closed on
Oct 7, 2015
Sold by
Farrell Eric O
Bought by
Wasson Adam L and Wasson Erica M
Create a Home Valuation Report for This Property
The Home Valuation Report is an in-depth analysis detailing your home's value as well as a comparison with similar homes in the area
Purchase History
| Date | Buyer | Sale Price | Title Company |
|---|---|---|---|
| Buschman Amy N | $267,187 | Springdale Title Llc | |
| Wasson Adam L | $195,000 | White County Abstract & Title |
Source: Public Records
Mortgage History
| Date | Status | Borrower | Loan Amount |
|---|---|---|---|
| Open | Buschman Amy N | $213,750 |
Source: Public Records
Tax History
| Year | Tax Paid | Tax Assessment Tax Assessment Total Assessment is a certain percentage of the fair market value that is determined by local assessors to be the total taxable value of land and additions on the property. | Land | Improvement |
|---|---|---|---|---|
| 2025 | $1,625 | $241,200 | $25,100 | $216,100 |
| 2024 | $1,625 | $257,200 | $25,100 | $232,100 |
| 2023 | $1,571 | $257,200 | $25,100 | $232,100 |
| 2022 | $1,553 | $234,400 | $23,700 | $210,700 |
| 2021 | $1,348 | $204,000 | $23,700 | $180,300 |
| 2020 | $1,358 | $204,000 | $23,700 | $180,300 |
| 2019 | $1,233 | $194,100 | $23,700 | $170,400 |
| 2018 | $1,143 | $184,200 | $23,700 | $160,500 |
| 2017 | $1,016 | $179,200 | $18,600 | $160,600 |
| 2016 | $965 | $169,700 | $18,700 | $151,000 |
| 2014 | $952 | $165,000 | $16,800 | $148,200 |
Source: Public Records
Map
Nearby Homes
- 10246 N 1200 W
- 5151 S Stone Dr
- 10563 N Corley Dr
- 11921 W Breezy Point Dr
- 11912 W Breezy Point Dr
- 11766 W 1000 N
- 5747 St Johns Ave
- 5748 St Johns Ave
- 11791 W Pirates Roost Rd
- 5758 St Johns Ave
- 11044 N Landing Rd
- 9742 N 1175 W
- 11086 N Landing Rd
- 11744 W White View Dr
- 504 S Park Dr
- 1329 Greenwood Dr
- 12386 W Crest Dr
- 7801 N Upper Hambridge Dr
- 0 Gordon Rd
- 11810 W 820 North Crossroad
Your Personal Tour Guide
Ask me questions while you tour the home.