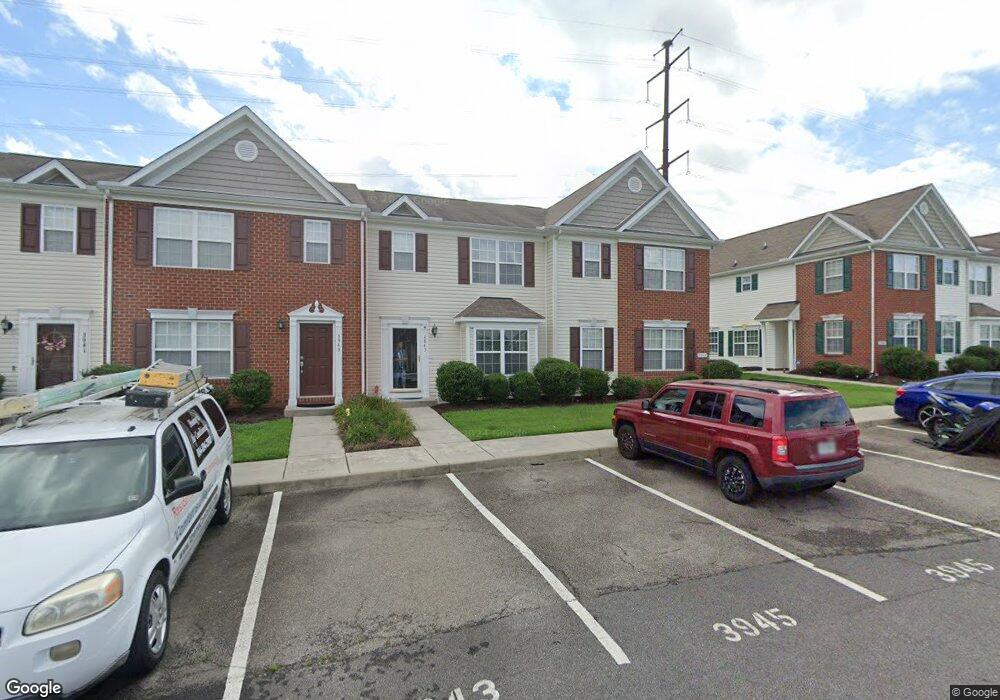
3945 Eagle Dr Hopewell, VA 23860
Estimated Value: $252,645 - $314,000
3
Beds
3
Baths
1,600
Sq Ft
$176/Sq Ft
Est. Value
About This Home
This home is located at 3945 Eagle Dr, Hopewell, VA 23860 and is currently estimated at $281,661, approximately $176 per square foot. 3945 Eagle Dr is a home located in Hopewell City with nearby schools including Carter G. Woodson Middle School, Hopewell High School, and West End Christian School.
Ownership History
Date
Name
Owned For
Owner Type
Purchase Details
Closed on
Oct 15, 2012
Sold by
Reid Markus and Reid Roane Terrie
Bought by
Craine Anthony L
Current Estimated Value
Home Financials for this Owner
Home Financials are based on the most recent Mortgage that was taken out on this home.
Original Mortgage
$143,056
Outstanding Balance
$99,434
Interest Rate
3.59%
Mortgage Type
VA
Estimated Equity
$182,227
Purchase Details
Closed on
Dec 12, 2011
Sold by
Secretary Of Veterans Affairs
Bought by
Reid Markus
Purchase Details
Closed on
Oct 8, 2010
Sold by
Recon Trust Co Na
Bought by
Bac Home Loans Servicing Lp
Purchase Details
Closed on
Jul 13, 2009
Sold by
Craftmaster Homes Inc
Bought by
Aderholt Michael S and Aderholt Sarra D
Home Financials for this Owner
Home Financials are based on the most recent Mortgage that was taken out on this home.
Original Mortgage
$177,865
Interest Rate
4.93%
Mortgage Type
VA
Create a Home Valuation Report for This Property
The Home Valuation Report is an in-depth analysis detailing your home's value as well as a comparison with similar homes in the area
Home Values in the Area
Average Home Value in this Area
Purchase History
| Date | Buyer | Sale Price | Title Company |
|---|---|---|---|
| Craine Anthony L | $145,000 | -- | |
| Reid Markus | $68,250 | -- | |
| Bac Home Loans Servicing Lp | $141,889 | -- | |
| Aderholt Michael S | $177,865 | -- |
Source: Public Records
Mortgage History
| Date | Status | Borrower | Loan Amount |
|---|---|---|---|
| Open | Aderholt Michael S | $143,056 | |
| Previous Owner | Aderholt Michael S | $177,865 |
Source: Public Records
Tax History
| Year | Tax Paid | Tax Assessment Tax Assessment Total Assessment is a certain percentage of the fair market value that is determined by local assessors to be the total taxable value of land and additions on the property. | Land | Improvement |
|---|---|---|---|---|
| 2025 | $2,359 | $201,600 | $27,100 | $174,500 |
| 2024 | $2,218 | $189,600 | $26,600 | $163,000 |
| 2023 | $2,142 | $189,600 | $26,600 | $163,000 |
| 2022 | $1,735 | $153,500 | $23,900 | $129,600 |
| 2021 | $1,735 | $153,500 | $23,900 | $129,600 |
| 2020 | $1,603 | $141,900 | $26,600 | $115,300 |
| 2019 | $1,603 | $141,900 | $26,600 | $115,300 |
| 2018 | $1,553 | $137,400 | $26,600 | $110,800 |
| 2017 | $1,553 | $137,400 | $26,600 | $110,800 |
| 2016 | $1,645 | $145,600 | $31,300 | $114,300 |
| 2015 | $1,645 | $145,600 | $31,300 | $114,300 |
| 2014 | $1,647 | $148,400 | $32,900 | $115,500 |
Source: Public Records
Map
Nearby Homes
- 3803 Eagle Dr
- 4203 Eagle Dr
- 3801 Crows Nest Ct
- 4204 Eagle Dr
- 3800 Crows Nest Ct
- 3808 Crows Nest Ct
- 4206 Eagle Dr
- 4211 Eagle Dr
- 3807 Crows Nest Ct
- 3906 Lighthouse Ln
- 3909 Schooner Ln
- 3408 W Broadway
- 301 Beacon Ridge Dr Unit 304
- 301 Beacon Ridge Dr Unit 109
- 301 Beacon Ridge Dr Unit 804
- 3408 N Radford Dr
- 423 Atwater Rd
- 112 S Colonial Dr
- 4200 River Vista Ln
- 3020 W Grant St
- 3945 Eagle Dr Unit 3945
- 3945 Eagle Dr
- 3943 Eagle Dr
- 3943 Eagle Dr Unit 3943
- 3943 Eagle Dr
- 3947 Eagle Dr
- 3947 Eagle Dr Unit 3947
- 3941 Eagle Dr
- 3941 Eagle Dr Unit 3941
- 3941 Eagle Dr Unit 3941
- 3939 Eagle Dr
- 3939 Eagle Dr Unit 3939
- 3939 Eagle Dr Unit 1
- 3949 Eagle Dr
- 3949 Eagle Dr Unit 3949
- 3951 Eagle Dr
- 3951 Eagle Dr Unit 3951
- 3951 Eagle Dr
- 3951 Eagle Dr Unit 22
- 3937 Eagle Dr
Your Personal Tour Guide
Ask me questions while you tour the home.