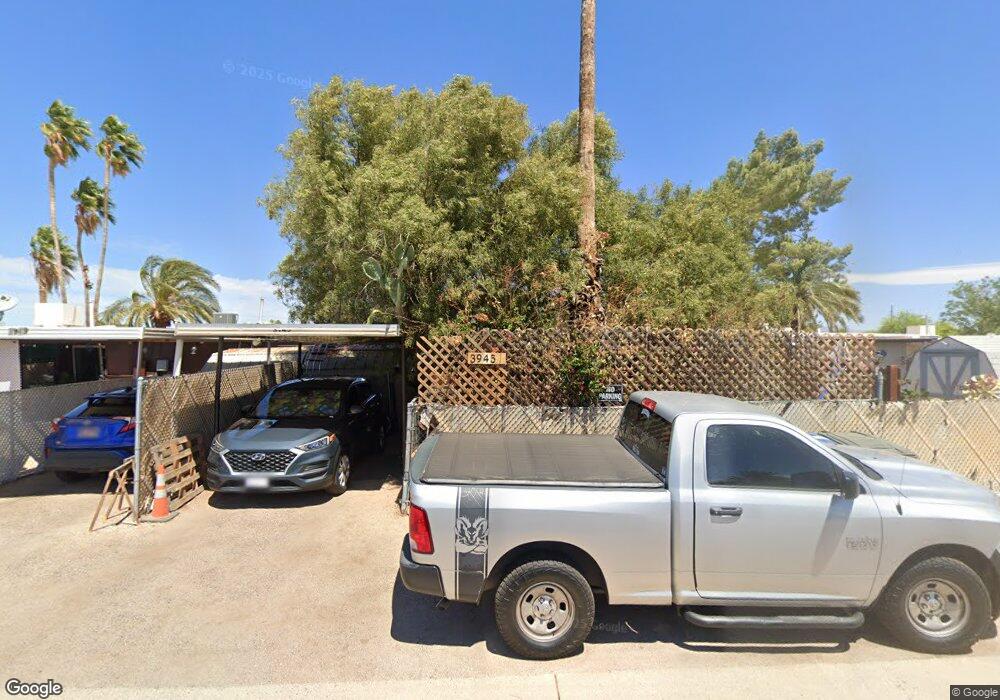
3945 S Queen Palm Dr Tucson, AZ 85730
Groves Lincoln Park NeighborhoodEstimated Value: $128,697 - $190,000
--
Bed
1
Bath
873
Sq Ft
$191/Sq Ft
Est. Value
About This Home
This home is located at 3945 S Queen Palm Dr, Tucson, AZ 85730 and is currently estimated at $166,924, approximately $191 per square foot. 3945 S Queen Palm Dr is a home located in Pima County with nearby schools including Irene Erickson Elementary School, Secrist Middle School, and Santa Rita High School.
Ownership History
Date
Name
Owned For
Owner Type
Purchase Details
Closed on
Apr 17, 2008
Sold by
Kimbrel Alva Scott and Kimbrel Ruby J Williard
Bought by
Kimbrel Alva Scott and Williard Ruthy J
Current Estimated Value
Home Financials for this Owner
Home Financials are based on the most recent Mortgage that was taken out on this home.
Original Mortgage
$95,410
Outstanding Balance
$61,501
Interest Rate
6.31%
Mortgage Type
New Conventional
Estimated Equity
$105,423
Purchase Details
Closed on
Feb 16, 2006
Sold by
Kimbrel Ruthy J Willard and Willard Ruth J
Bought by
Kimbrel Alva Scott and Kimbrel Ruthy J Willard
Purchase Details
Closed on
May 20, 2002
Sold by
Kimbrel Alva Scott
Bought by
Willard Ruth J
Purchase Details
Closed on
Feb 22, 2001
Sold by
Willard Ruth J
Bought by
Kimbrel Alva Scott and Willard Ruth J
Home Financials for this Owner
Home Financials are based on the most recent Mortgage that was taken out on this home.
Original Mortgage
$47,874
Interest Rate
6.98%
Create a Home Valuation Report for This Property
The Home Valuation Report is an in-depth analysis detailing your home's value as well as a comparison with similar homes in the area
Home Values in the Area
Average Home Value in this Area
Purchase History
| Date | Buyer | Sale Price | Title Company |
|---|---|---|---|
| Kimbrel Alva Scott | -- | Tlati | |
| Kimbrel Alva Scott | -- | Tlati | |
| Kimbrel Alva Scott | -- | Tfati | |
| Willard Ruth J | -- | -- | |
| Kimbrel Alva Scott | -- | -- |
Source: Public Records
Mortgage History
| Date | Status | Borrower | Loan Amount |
|---|---|---|---|
| Open | Kimbrel Alva Scott | $95,410 | |
| Closed | Kimbrel Alva Scott | $95,410 | |
| Previous Owner | Kimbrel Alva Scott | $47,874 |
Source: Public Records
Tax History Compared to Growth
Tax History
| Year | Tax Paid | Tax Assessment Tax Assessment Total Assessment is a certain percentage of the fair market value that is determined by local assessors to be the total taxable value of land and additions on the property. | Land | Improvement |
|---|---|---|---|---|
| 2025 | $605 | $5,414 | -- | -- |
| 2024 | $605 | $5,157 | -- | -- |
| 2023 | $571 | $4,911 | $0 | $0 |
| 2022 | $571 | $4,677 | $0 | $0 |
| 2021 | $573 | $4,242 | $0 | $0 |
| 2020 | $550 | $4,242 | $0 | $0 |
| 2019 | $534 | $4,851 | $0 | $0 |
| 2018 | $510 | $3,665 | $0 | $0 |
| 2017 | $487 | $3,665 | $0 | $0 |
| 2016 | $545 | $4,012 | $0 | $0 |
| 2015 | $522 | $3,821 | $0 | $0 |
Source: Public Records
Map
Nearby Homes
- 3994 S Evergreen Ave
- 3886 S Evergreen Ave
- 4126 S Evergreen Ave
- 3872 S Evergreen Ave
- 3817 S Queen Palm Dr
- 4190 S Evergreen Ave
- 3803 S Queen Palm Dr
- 7735 E Basswood Place
- 7411 E Poinciana Place
- 3763 S Amos Place
- 3748 S Amos Place
- 3747 S Amos Place
- 7361 E Desert Aire Dr
- 3650 S Chesin Dr
- 7241 E Pomegranate St
- 7231 E Pomegranate St
- 3710 S Bellingham Place
- 7601 E 45th St
- 7201 E Chelsie Kaye Ln
- 7420 E 45th St
- 3949 S Queen Palm Dr
- 3941 S Queen Palm Dr
- 3953 S Queen Palm Dr
- 3957 S Queen Palm Dr
- 3933 S Queen Palm Dr
- 3973 S Queen Palm Dr
- 3981 S Queen Palm Dr
- 3937 S Queen Palm Dr
- 3977 S Queen Palm Dr
- 3929 S Queen Palm Dr
- 3969 S Queen Palm Dr
- 3905 S Queen Palm Dr
- 3909 S Queen Palm Dr
- 3901 S Queen Palm Dr
- 3925 S Queen Palm Dr
- 3965 S Queen Palm Dr
- 3985 S Queen Palm Dr
- 3961 S Queen Palm Dr
- 3921 S Queen Palm Dr
- 3917 S Queen Palm Dr