3945 Veatch Rd Gambier, OH 43022
Estimated Value: $358,000 - $423,029
3
Beds
2
Baths
1,728
Sq Ft
$224/Sq Ft
Est. Value
About This Home
This home is located at 3945 Veatch Rd, Gambier, OH 43022 and is currently estimated at $387,007, approximately $223 per square foot. 3945 Veatch Rd is a home located in Knox County with nearby schools including Utica High School.
Ownership History
Date
Name
Owned For
Owner Type
Purchase Details
Closed on
Jul 5, 2019
Sold by
Hardesty Ethan E and Hardesty Stephanie J
Bought by
Schisler Dane C and Schisler Vernon L
Current Estimated Value
Home Financials for this Owner
Home Financials are based on the most recent Mortgage that was taken out on this home.
Original Mortgage
$111,500
Outstanding Balance
$97,684
Interest Rate
3.82%
Mortgage Type
Stand Alone Refi Refinance Of Original Loan
Estimated Equity
$289,323
Purchase Details
Closed on
Jul 26, 2012
Sold by
Wilkes Larry G and Wilkes Eleena L
Bought by
Hardesty Ethan Edward and Hardesty Stephanie Jeannette
Home Financials for this Owner
Home Financials are based on the most recent Mortgage that was taken out on this home.
Original Mortgage
$164,050
Interest Rate
4.4%
Mortgage Type
FHA
Purchase Details
Closed on
Nov 2, 1998
Bought by
Wilkes Larry G and Wilkes Elcena L
Purchase Details
Closed on
Jun 2, 1998
Bought by
Countrytyme Grove City Lt
Create a Home Valuation Report for This Property
The Home Valuation Report is an in-depth analysis detailing your home's value as well as a comparison with similar homes in the area
Home Values in the Area
Average Home Value in this Area
Purchase History
| Date | Buyer | Sale Price | Title Company |
|---|---|---|---|
| Schisler Dane C | -- | Chicago Title | |
| Schisler Dane C | -- | Chicago Title | |
| Hardesty Ethan Edward | $127,500 | None Available | |
| Wilkes Larry G | $22,400 | -- | |
| Countrytyme Grove City Lt | -- | -- |
Source: Public Records
Mortgage History
| Date | Status | Borrower | Loan Amount |
|---|---|---|---|
| Open | Schisler Dane C | $111,500 | |
| Closed | Schisler Dane C | $111,500 | |
| Previous Owner | Hardesty Ethan Edward | $164,050 |
Source: Public Records
Tax History Compared to Growth
Tax History
| Year | Tax Paid | Tax Assessment Tax Assessment Total Assessment is a certain percentage of the fair market value that is determined by local assessors to be the total taxable value of land and additions on the property. | Land | Improvement |
|---|---|---|---|---|
| 2024 | $3,466 | $98,450 | $15,930 | $82,520 |
| 2023 | $3,466 | $98,450 | $15,930 | $82,520 |
| 2022 | $2,748 | $67,890 | $10,980 | $56,910 |
| 2021 | $2,748 | $67,890 | $10,980 | $56,910 |
| 2020 | $2,561 | $67,890 | $10,980 | $56,910 |
| 2019 | $2,463 | $61,360 | $9,400 | $51,960 |
| 2018 | $2,476 | $61,360 | $9,400 | $51,960 |
| 2017 | $2,469 | $61,360 | $9,400 | $51,960 |
| 2016 | $2,266 | $56,820 | $8,710 | $48,110 |
| 2015 | $2,246 | $56,820 | $8,710 | $48,110 |
| 2014 | $2,153 | $56,820 | $8,710 | $48,110 |
| 2013 | $2,132 | $54,130 | $5,910 | $48,220 |
Source: Public Records
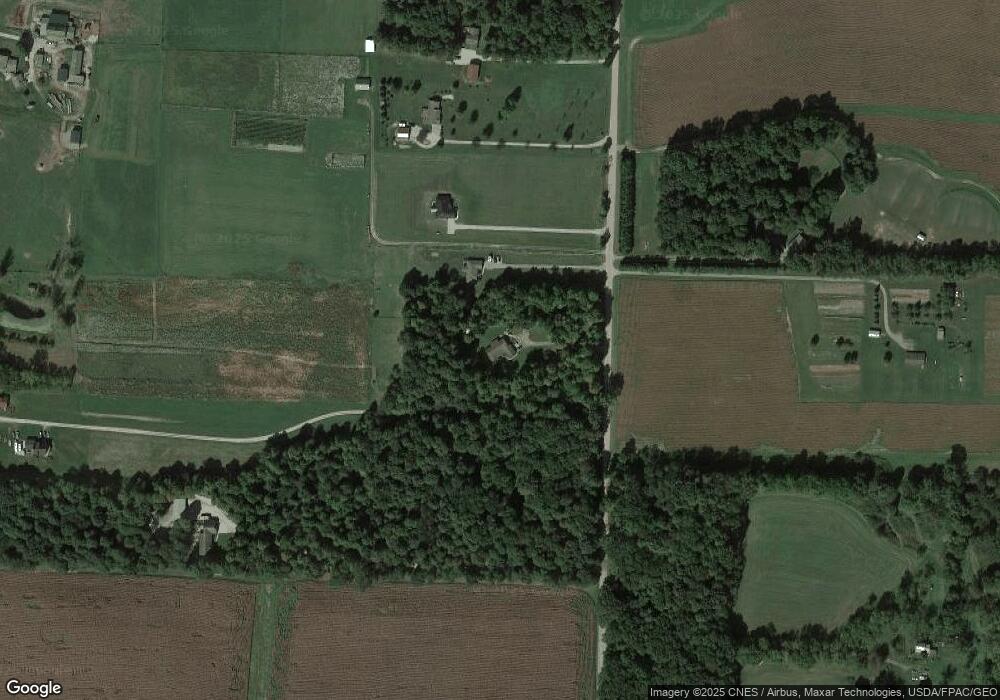
Map
Nearby Homes
- 26031 New Guilford Rd
- 4453 Owl Creek Church Rd
- 760 Henpeck Rd
- 0 Jug Run Rd Unit 224006737
- 0 Bone Road Lot#1
- 0 Bone Road Lot#2
- 0 Bone Road Lot#3
- 0 Bone Road Lot#4
- 29186 Aspen Rd
- 0 Bone Road Lot#5
- 0 Bone Road Lot#6
- 0 Bone Road Lot#7
- 8693 Grove Church Rd
- 0 Bone Road Lot#8
- 0 Bone Rd Unit Lot 8 225028406
- 0 Bone Rd Unit Lot 7 225028405
- 0 Bone Rd Unit Lot 3 225028401
- 0 Bone Rd Unit Lot 5 225028400
- 0 Bone Rd Unit Lot 6 225028397
- 0 Mckee Rd Unit 5148073