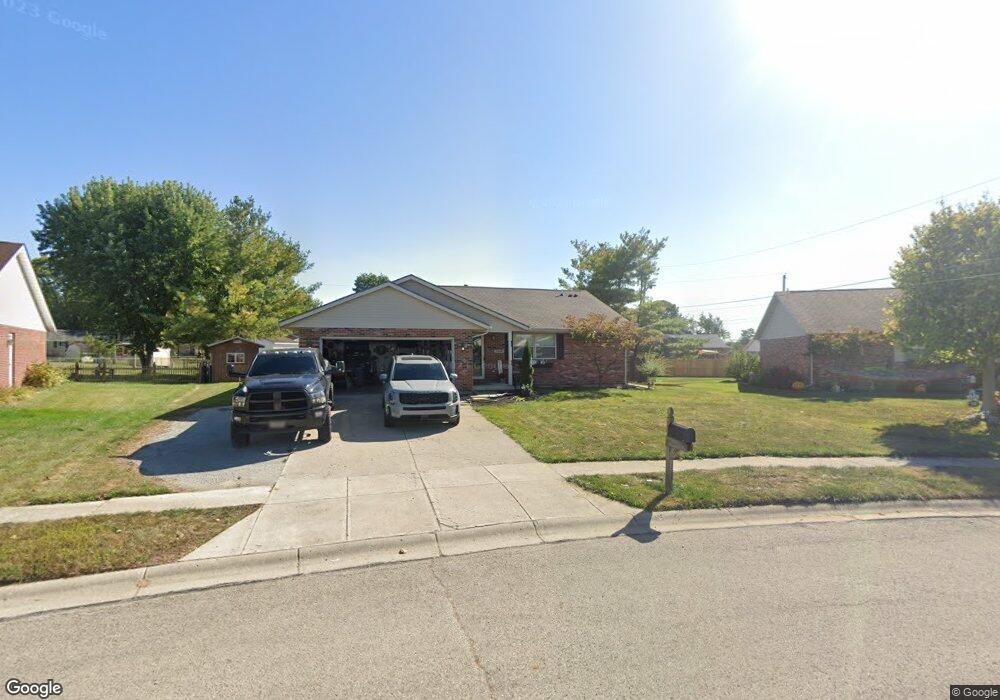
3946 Delmar Cir Springfield, OH 45503
Estimated Value: $256,087 - $267,000
3
Beds
2
Baths
1,487
Sq Ft
$177/Sq Ft
Est. Value
About This Home
This home is located at 3946 Delmar Cir, Springfield, OH 45503 and is currently estimated at $263,022, approximately $176 per square foot. 3946 Delmar Cir is a home located in Clark County with nearby schools including Northridge Elementary School, Kenton Ridge Middle & High School, and Emmanuel Christian Academy.
Ownership History
Date
Name
Owned For
Owner Type
Purchase Details
Closed on
Sep 26, 2019
Sold by
Valentine Anthony R
Bought by
Schrader Kyle S and Schrader Ashley D
Current Estimated Value
Home Financials for this Owner
Home Financials are based on the most recent Mortgage that was taken out on this home.
Original Mortgage
$159,600
Outstanding Balance
$138,577
Interest Rate
3.5%
Mortgage Type
New Conventional
Estimated Equity
$124,445
Purchase Details
Closed on
Jul 28, 2016
Sold by
Eaton Mark K and Eaton Kathleen M
Bought by
Valentine Anthony R
Home Financials for this Owner
Home Financials are based on the most recent Mortgage that was taken out on this home.
Original Mortgage
$150,228
Interest Rate
3.54%
Mortgage Type
FHA
Purchase Details
Closed on
Mar 11, 1996
Sold by
Hoppes Builders & Dev Co
Bought by
Eaton Mark K and Eaton Kathleen
Home Financials for this Owner
Home Financials are based on the most recent Mortgage that was taken out on this home.
Original Mortgage
$104,405
Interest Rate
7.05%
Mortgage Type
New Conventional
Create a Home Valuation Report for This Property
The Home Valuation Report is an in-depth analysis detailing your home's value as well as a comparison with similar homes in the area
Home Values in the Area
Average Home Value in this Area
Purchase History
| Date | Buyer | Sale Price | Title Company |
|---|---|---|---|
| Schrader Kyle S | $168,000 | Sterling Land Title Agcy Inc | |
| Valentine Anthony R | $153,000 | Team Title & Closing Service | |
| Eaton Mark K | $109,900 | -- |
Source: Public Records
Mortgage History
| Date | Status | Borrower | Loan Amount |
|---|---|---|---|
| Open | Schrader Kyle S | $159,600 | |
| Closed | Valentine Anthony R | $150,228 | |
| Previous Owner | Eaton Mark K | $104,405 |
Source: Public Records
Tax History
| Year | Tax Paid | Tax Assessment Tax Assessment Total Assessment is a certain percentage of the fair market value that is determined by local assessors to be the total taxable value of land and additions on the property. | Land | Improvement |
|---|---|---|---|---|
| 2025 | $2,564 | $86,780 | $13,490 | $73,290 |
| 2024 | $2,480 | $58,640 | $11,960 | $46,680 |
| 2023 | $2,480 | $58,640 | $11,960 | $46,680 |
| 2022 | $2,489 | $58,640 | $11,960 | $46,680 |
| 2021 | $2,548 | $50,880 | $9,270 | $41,610 |
| 2020 | $2,550 | $50,880 | $9,270 | $41,610 |
| 2019 | $2,599 | $50,880 | $9,270 | $41,610 |
| 2018 | $2,695 | $50,560 | $8,500 | $42,060 |
| 2017 | $2,311 | $46,739 | $8,498 | $38,241 |
| 2016 | $2,354 | $46,739 | $8,498 | $38,241 |
| 2015 | $2,276 | $46,494 | $8,253 | $38,241 |
| 2014 | $2,276 | $46,494 | $8,253 | $38,241 |
| 2013 | $2,224 | $46,494 | $8,253 | $38,241 |
Source: Public Records
Map
Nearby Homes
- 1831 Pinehurst Dr Unit 37
- 1711 Pinehurst Dr
- 1503 Kingsgate Rd
- 1505 Kingsgate Rd
- 1507 Kingsgate Rd
- 1500 Kingsgate Rd
- 1502 Kingsgate Rd
- 1500 Kingsgate Rd Unit 19430
- 1502 Kingsgate Rd Unit 19432
- 1509 Kingsgate Rd
- 3631 Kingsgate Ln
- 4256 Midfield St Unit 9
- 3969 Covington Dr Unit 3969
- 4028 Ryland Dr Unit 4028
- 4446 Ridgewood Rd E Unit 3
- 1201 Kingsgate Rd
- 1341 Student Ave
- 1162 Kingsgate Rd
- 4577 Reno Ln Unit 2
- 3126 Lakeview Ct Unit 3126
- 3952 Delmar Cir
- 3941 Delmar Cir
- 1734 Elaina Dr
- 1740 Elaina Dr
- 1728 Elaina Dr
- 1746 Elaina Dr
- 3956 Delmar Cir
- 3909 Kimberly Dr
- 3937 Delmar Cir
- 1722 Elaina Dr
- 3951 Delmar Cir
- 3917 Kimberly Dr
- 3928 Delmar Cir
- 3905 Kimberly Dr
- 1714 Elaina Dr
- 3960 Delmar Cir
- 3931 Delmar Cir
- 3923 Kimberly Dr
- 3963 Delmar Cir
- 3927 Delmar Cir
Your Personal Tour Guide
Ask me questions while you tour the home.