Estimated Value: $380,000 - $412,000
About This Home
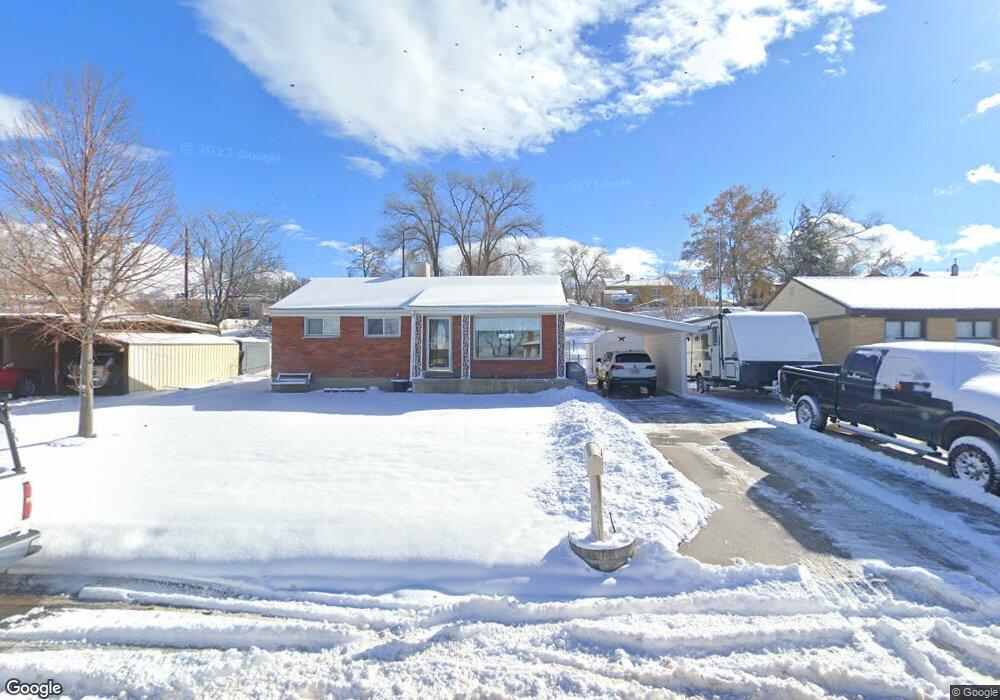
This home is located at 3946 S 2275 W, Roy, UT 84067 and is currently estimated at $394,345, approximately $210 per square foot. 3946 S 2275 W is a home located in Weber County with nearby schools including North Park School, Sand Ridge Junior High School, and Roy High School.
Ownership History
We collect this data history from publicly available records. To have your information removed, we recommend requesting removal directly through your county’s website.
Purchase Details
Home Financials for this Owner
Home Financials are based on the most recent Mortgage that was taken out on this home.Purchase Details
Home Values in the Area
Average Home Value in this Area
Purchase History
We collect this data history from publicly available records. To have your information removed, we recommend requesting removal directly through your county’s website.
| Date | Buyer | Sale Price | Title Company |
|---|---|---|---|
| -- | First American Title Ins Co | ||
| -- | None Available |
Mortgage History
We collect this data history from publicly available records. To have your information removed, we recommend requesting removal directly through your county’s website.
| Date | Status | Borrower | Loan Amount |
|---|---|---|---|
| Open | $282,000 |
Tax History
We collect this data history from publicly available records. To have your information removed, we recommend requesting removal directly through your county’s website.
| Year | Tax Paid | Tax Assessment Tax Assessment Total Assessment is a certain percentage of the fair market value that is determined by local assessors to be the total taxable value of land and additions on the property. | Land | Improvement |
|---|---|---|---|---|
| 2025 | $2,361 | $369,800 | $118,287 | $251,513 |
| 2024 | $2,302 | $199,649 | $64,691 | $134,958 |
| 2023 | $2,071 | $178,200 | $61,001 | $117,199 |
| 2022 | $2,137 | $190,300 | $52,254 | $138,046 |
| 2021 | $1,708 | $248,000 | $65,000 | $183,000 |
| 2020 | $1,624 | $217,000 | $65,000 | $152,000 |
| 2019 | $1,603 | $202,000 | $40,050 | $161,950 |
| 2018 | $1,448 | $170,000 | $34,953 | $135,047 |
| 2017 | $1,329 | $145,000 | $32,987 | $112,013 |
| 2016 | $1,256 | $73,358 | $13,358 | $60,000 |
| 2015 | $1,089 | $63,935 | $16,649 | $47,286 |
| 2014 | $1,092 | $63,579 | $16,649 | $46,930 |
Map
- 2101 W 3900 S
- 2260 W 3875 S
- 2240 W 3875 S
- 4047 S 2175 W
- 4061 S 2175 W
- 4046 Sandridge Dr Unit 3
- 4046 Sandridge Dr Unit 2
- 4046 Sandridge Dr Unit 4
- 4046 Sandridge Dr
- 4046 Sandridge Dr Unit 1
- 4082 S Sandridge Dr Unit 6
- 3860 Midland Dr Unit C10
- 3860 Midland Dr Unit A-60
- 3860 Midland Dr Unit A18
- 4103 S 2175 W
- 4082 S Sandridge Dr #6
- 3948 S 2525 W
- 3923 S 1975 W Unit 15
- 4164 S 2400 W
- 2565 W 3950 S
Ask me questions while you tour the home.