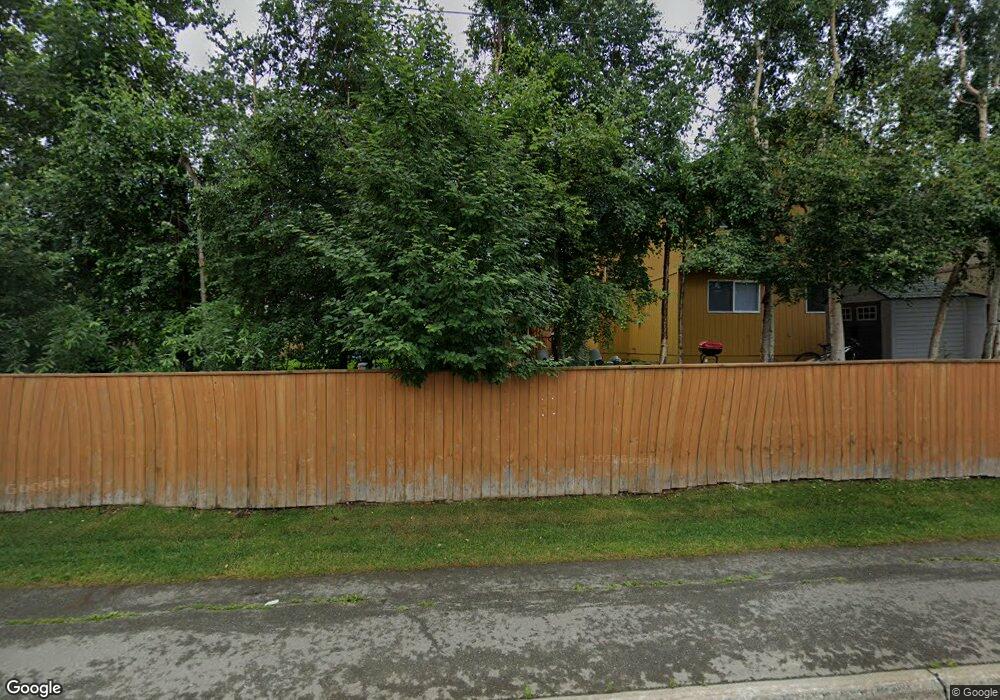
3946 Sycamore Loop Anchorage, AK 99504
Scenic Foothills NeighborhoodEstimated Value: $328,000 - $431,000
3
Beds
2
Baths
1,560
Sq Ft
$243/Sq Ft
Est. Value
About This Home
This home is located at 3946 Sycamore Loop, Anchorage, AK 99504 and is currently estimated at $379,296, approximately $243 per square foot. 3946 Sycamore Loop is a home located in Anchorage Municipality with nearby schools including Scenic Park Elementary School, Nicholas J. Begich Middle School, and Bartlett High School.
Ownership History
Date
Name
Owned For
Owner Type
Purchase Details
Closed on
Oct 29, 2007
Sold by
Lee Jae W
Bought by
Lee Jae W and Lee Hyunjeo
Current Estimated Value
Home Financials for this Owner
Home Financials are based on the most recent Mortgage that was taken out on this home.
Original Mortgage
$224,730
Outstanding Balance
$141,836
Interest Rate
6.42%
Mortgage Type
VA
Estimated Equity
$237,460
Purchase Details
Closed on
Oct 11, 2007
Sold by
Parsons Danny L and Parsons Edna E
Bought by
Lee Jae W
Home Financials for this Owner
Home Financials are based on the most recent Mortgage that was taken out on this home.
Original Mortgage
$224,730
Outstanding Balance
$141,836
Interest Rate
6.42%
Mortgage Type
VA
Estimated Equity
$237,460
Purchase Details
Closed on
Mar 25, 2005
Sold by
Parsons Danny L
Bought by
Parsons Edna E
Home Financials for this Owner
Home Financials are based on the most recent Mortgage that was taken out on this home.
Original Mortgage
$154,800
Interest Rate
5.25%
Mortgage Type
New Conventional
Purchase Details
Closed on
Oct 30, 2000
Sold by
Barton Brendon M and Barton Alison K
Bought by
Parsons Danny L and Parsons Edna E
Home Financials for this Owner
Home Financials are based on the most recent Mortgage that was taken out on this home.
Original Mortgage
$162,740
Interest Rate
7.89%
Mortgage Type
New Conventional
Purchase Details
Closed on
Dec 19, 1996
Sold by
Hultquist Construction Inc
Bought by
Barton Brendon M and Barton Alison K
Home Financials for this Owner
Home Financials are based on the most recent Mortgage that was taken out on this home.
Original Mortgage
$139,264
Interest Rate
7.67%
Mortgage Type
FHA
Create a Home Valuation Report for This Property
The Home Valuation Report is an in-depth analysis detailing your home's value as well as a comparison with similar homes in the area
Home Values in the Area
Average Home Value in this Area
Purchase History
| Date | Buyer | Sale Price | Title Company |
|---|---|---|---|
| Lee Jae W | -- | First American Title Of Ak | |
| Lee Jae W | -- | First American Title Ins Co | |
| Parsons Edna E | -- | -- | |
| Parsons Danny L | -- | -- | |
| Barton Brendon M | -- | -- |
Source: Public Records
Mortgage History
| Date | Status | Borrower | Loan Amount |
|---|---|---|---|
| Open | Lee Jae W | $224,730 | |
| Previous Owner | Parsons Edna E | $154,800 | |
| Previous Owner | Parsons Danny L | $162,740 | |
| Previous Owner | Barton Brendon M | $139,264 |
Source: Public Records
Tax History
| Year | Tax Paid | Tax Assessment Tax Assessment Total Assessment is a certain percentage of the fair market value that is determined by local assessors to be the total taxable value of land and additions on the property. | Land | Improvement |
|---|---|---|---|---|
| 2025 | $5,267 | $350,200 | $78,300 | $271,900 |
| 2024 | $5,267 | $326,200 | $78,300 | $247,900 |
| 2023 | $4,940 | $290,100 | $78,300 | $211,800 |
| 2022 | $4,801 | $285,100 | $78,300 | $206,800 |
| 2021 | $4,608 | $255,700 | $78,300 | $177,400 |
| 2020 | $4,417 | $259,800 | $78,300 | $181,500 |
| 2019 | $4,290 | $262,200 | $78,300 | $183,900 |
| 2018 | $4,297 | $262,000 | $74,200 | $187,800 |
| 2017 | $3,996 | $255,200 | $74,200 | $181,000 |
| 2016 | $3,812 | $251,700 | $71,300 | $180,400 |
| 2015 | $3,812 | $257,300 | $71,300 | $186,000 |
| 2014 | $3,812 | $256,900 | $71,300 | $185,600 |
Source: Public Records
Map
Nearby Homes
- 8810 Pioneer Dr
- 3420 Meadowbrook Cir
- 8050 Pioneer Dr Unit 303
- 7714 Hennings Way
- 8500 Ridgeway Ave
- 7004 Meteor Ct
- 7031 Baxter Terrace Cir
- 7989 Hillshire Ct Unit 39
- 8041 Astonshire Ct Unit 85
- 7017 Cape Lisburne Loop
- 2291 Duncanshire Place Unit 154
- 2221 Muldoon Rd Unit 280
- 2221 Muldoon Rd Unit 68
- 2221 Muldoon Rd Unit 524
- 6918 Gemini Dr Unit B2
- 7524 Eastbrook Cir
- 8510 Hidden View Ct
- 7221 Kiska Cir
- 1900 Muldoon Rd
- 4430 View Ct Unit 1
- 4000 Sycamore Loop
- 3940 Sycamore Loop
- 4006 Sycamore Loop
- 3934 Sycamore Loop
- 4012 Sycamore Loop
- 3928 Sycamore Loop
- 4018 Sycamore Loop
- 3922 Sycamore Loop
- L31 B2 Sycamore Loop
- L7 B1 Sycamore Loop
- L10 B1 Sycamore Loop
- 4015 Sycamore Loop
- 4024 Sycamore Loop
- 3916 Sycamore Loop
- 8211 E 36th Ave
- 4021 Sycamore Loop
- 8221 E 36th Ave
- 8201 E 36th Ave
- 8201 E 36th Ave Unit A
- 3919 Sycamore Loop
Your Personal Tour Guide
Ask me questions while you tour the home.