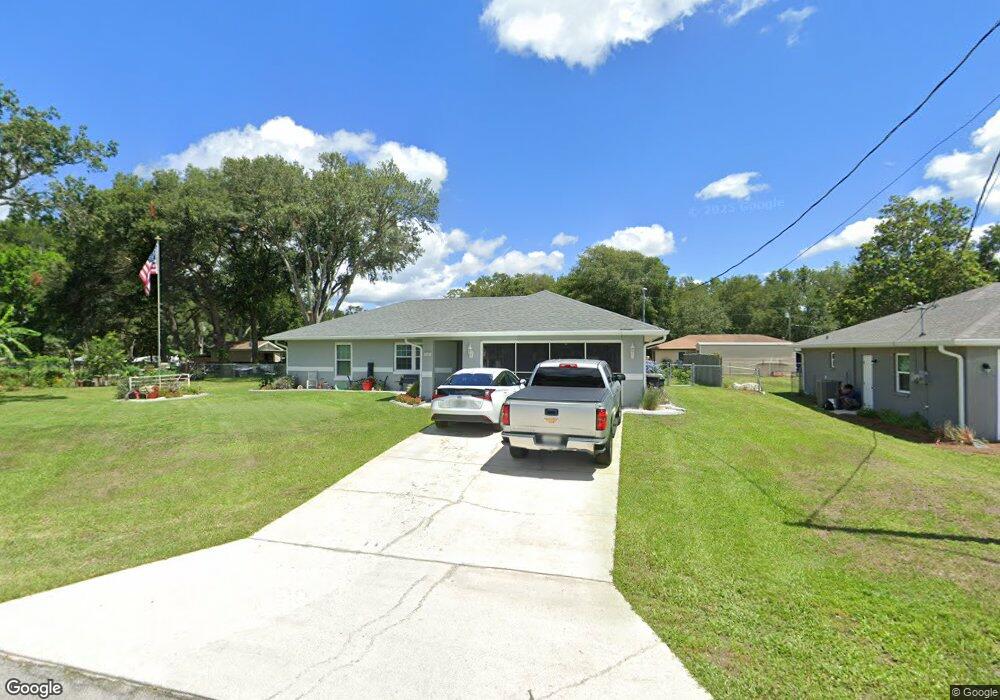
3947 E Allendale St Inverness, FL 34453
Estimated Value: $215,634 - $235,000
3
Beds
2
Baths
1,256
Sq Ft
$180/Sq Ft
Est. Value
About This Home
This home is located at 3947 E Allendale St, Inverness, FL 34453 and is currently estimated at $225,909, approximately $179 per square foot. 3947 E Allendale St is a home located in Citrus County with nearby schools including Hernando Elementary School, Inverness Middle School, and Citrus High School.
Ownership History
Date
Name
Owned For
Owner Type
Purchase Details
Closed on
May 4, 2021
Sold by
Wingate Darrell W and Wingate Charlene A
Bought by
Wingate Darrell W and Wingate Charlene A
Current Estimated Value
Purchase Details
Closed on
Jul 25, 2018
Sold by
Cullum Jonathan
Bought by
Wingale Darrell and Wingale Charlene
Home Financials for this Owner
Home Financials are based on the most recent Mortgage that was taken out on this home.
Original Mortgage
$68,000
Interest Rate
4.5%
Mortgage Type
New Conventional
Purchase Details
Closed on
May 31, 2016
Bought by
Cullum Jonathan
Purchase Details
Closed on
Mar 15, 2016
Sold by
Eberhardt Joseph M and Eberhardt Bethany J
Bought by
U S Bank National Association
Purchase Details
Closed on
Mar 3, 2016
Sold by
Eberhardt Joseph M and Eberhardt Bethany J
Bought by
U S Bank National Association
Purchase Details
Closed on
Jan 1, 2011
Bought by
Cullum Jonathan
Create a Home Valuation Report for This Property
The Home Valuation Report is an in-depth analysis detailing your home's value as well as a comparison with similar homes in the area
Home Values in the Area
Average Home Value in this Area
Purchase History
We collect this data history from publicly available records. To have your information removed, we recommend requesting removal directly through your county’s website.
| Date | Buyer | Sale Price | Title Company |
|---|---|---|---|
| Wingate Darrell W | $100 | None Listed On Document | |
| Wingale Darrell | $118,000 | Wollinka Wikle Title Ins Age | |
| Cullum Jonathan | $59,500 | -- | |
| U S Bank National Association | $40,000 | None Available | |
| U S Bank National Association | $40,000 | None Available | |
| Cullum Jonathan | $100 | -- |
Source: Public Records
Mortgage History
We collect this data history from publicly available records. To have your information removed, we recommend requesting removal directly through your county’s website.
| Date | Status | Borrower | Loan Amount |
|---|---|---|---|
| Previous Owner | Wingale Darrell | $68,000 |
Source: Public Records
Tax History
| Year | Tax Paid | Tax Assessment Tax Assessment Total Assessment is a certain percentage of the fair market value that is determined by local assessors to be the total taxable value of land and additions on the property. | Land | Improvement |
|---|---|---|---|---|
| 2025 | $887 | $92,276 | -- | -- |
| 2024 | $791 | $89,675 | -- | -- |
| 2023 | $791 | $82,743 | $0 | $0 |
| 2022 | $740 | $80,333 | $0 | $0 |
| 2021 | $710 | $77,993 | $0 | $0 |
| 2020 | $643 | $107,094 | $6,880 | $100,214 |
| 2019 | $628 | $95,950 | $6,080 | $89,870 |
| 2018 | $590 | $76,750 | $5,200 | $71,550 |
| 2017 | $594 | $69,694 | $4,620 | $65,074 |
| 2016 | $497 | $52,451 | $4,620 | $47,831 |
| 2015 | $500 | $52,086 | $4,620 | $47,466 |
| 2014 | $512 | $51,673 | $5,417 | $46,256 |
Source: Public Records
Map
Nearby Homes
- 3920 E Allendale St
- 4131 E Berry St
- 0 E Allendale St
- 3848 E Wilma St
- 4133 E Wilma St
- 3926 E Bennett St
- 3980 E Bennett St
- 4102 E Berry St
- 3943 E Scotty St
- 488 N Corbin Ave
- 550 N Independence Hwy Unit 31
- 550 N Independence Hwy Unit 95
- 550 N Independence Hwy Unit 25
- 468 N Wheeler Ave
- 605 N Corbin Ave
- 276 N Cunningham Ave
- 4053 E Grant St
- 3916 E Grant St
- 3934 E Grant St
- 3956 E Grant St
- 3947 E Allendale St Unit 120
- 3944 E Berry St
- 3961 E Allendale St
- 3930 E Berry St
- 3913 E Allendale St
- 3942 E Allendale St
- 3952 E Allendale St
- 3975 E Allendale St
- 3912 E Berry St
- 3897 E Allendale St
- 0 E Berry St
- 3925 E Berry St
- 3939 E Wilma St
- 3953 E Wilma St
- 3994 E Berry St
- 3967 E Wilma St
- 3971 E Berry St
- 3909 E Wilma St
- 3866 E Allendale St
- 3981 E Wilma St
Your Personal Tour Guide
Ask me questions while you tour the home.