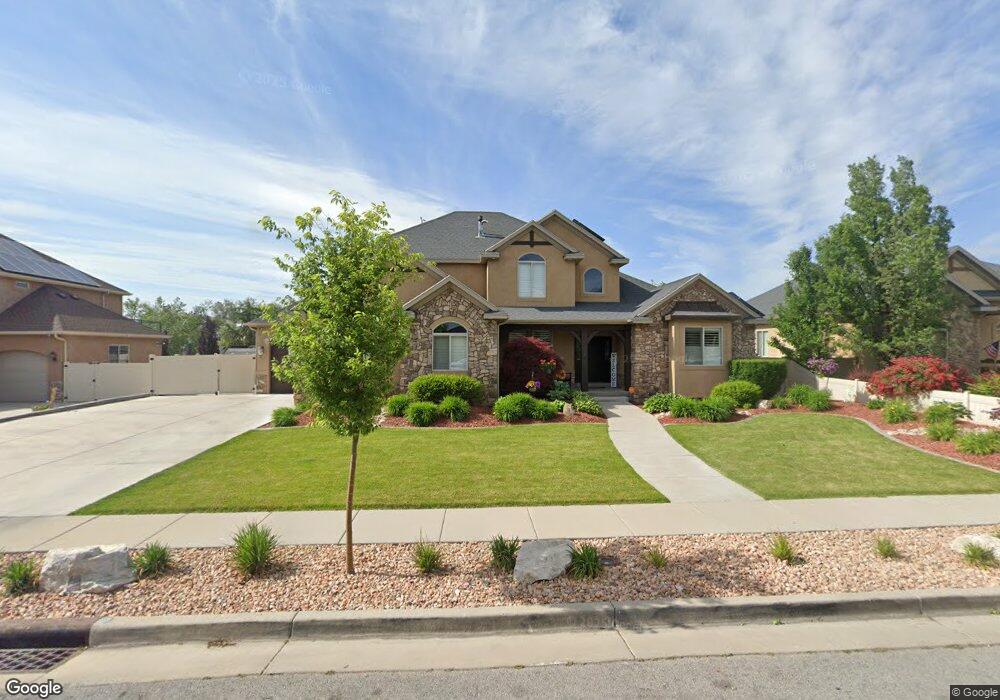
3947 Winthrope Dr West Jordan, UT 84088
Jordan Oaks NeighborhoodEstimated Value: $756,000 - $939,591
4
Beds
3
Baths
2,545
Sq Ft
$328/Sq Ft
Est. Value
About This Home
This home is located at 3947 Winthrope Dr, West Jordan, UT 84088 and is currently estimated at $833,648, approximately $327 per square foot. 3947 Winthrope Dr is a home located in Salt Lake County with nearby schools including Terra Linda Elementary School, Elk Ridge Middle School, and West Jordan High School.
Ownership History
Date
Name
Owned For
Owner Type
Purchase Details
Closed on
Aug 8, 2020
Sold by
Johnson Travis Scott and Johnson Kristi Racquel
Bought by
Johnson Kristi Racquel and Johnson Travis Scott
Current Estimated Value
Home Financials for this Owner
Home Financials are based on the most recent Mortgage that was taken out on this home.
Original Mortgage
$350,000
Outstanding Balance
$248,521
Interest Rate
3%
Mortgage Type
New Conventional
Estimated Equity
$585,127
Purchase Details
Closed on
Jun 8, 2016
Sold by
Johnson Travis Scott and Johnson Kristi Racquel
Bought by
The Kristi Racquel Johnson Trust and Johnson Travis Scott
Home Financials for this Owner
Home Financials are based on the most recent Mortgage that was taken out on this home.
Original Mortgage
$365,000
Interest Rate
3.66%
Mortgage Type
New Conventional
Purchase Details
Closed on
Oct 23, 2012
Sold by
Johnson Travis Scott and Johnson Kristi Racquel
Bought by
Johnson Kristi Racquel and Johnson Travis Scott
Home Financials for this Owner
Home Financials are based on the most recent Mortgage that was taken out on this home.
Original Mortgage
$383,488
Interest Rate
3.25%
Mortgage Type
FHA
Purchase Details
Closed on
Feb 17, 2011
Sold by
Johnson Travis S and Johnson Kristi R
Bought by
Johnson Kristi Racquel and Johnson Travis Scott
Purchase Details
Closed on
Jul 10, 2009
Sold by
Roman Land Holdings Llc
Bought by
Johnson Travis S and Johnson Kristi R
Home Financials for this Owner
Home Financials are based on the most recent Mortgage that was taken out on this home.
Original Mortgage
$392,656
Interest Rate
5.25%
Mortgage Type
FHA
Purchase Details
Closed on
Sep 22, 2008
Sold by
Deseret Sky Development Llc
Bought by
Roman Land Holdings Llc
Purchase Details
Closed on
Mar 14, 2007
Sold by
Naylor Farms Estates Llc
Bought by
Deseret Sky Development Llc
Purchase Details
Closed on
Mar 8, 2007
Sold by
Naylor Farms Estates Llc
Bought by
Deseret Sky Development Llc
Purchase Details
Closed on
Nov 16, 2006
Sold by
Naylor Farms Estates Llc
Bought by
Deseret Sky Development Llc
Purchase Details
Closed on
Aug 17, 2006
Sold by
Deseret Sky Development Llc
Bought by
Naylor Farms Estates Llc
Home Financials for this Owner
Home Financials are based on the most recent Mortgage that was taken out on this home.
Original Mortgage
$527,900
Interest Rate
6.76%
Mortgage Type
Construction
Create a Home Valuation Report for This Property
The Home Valuation Report is an in-depth analysis detailing your home's value as well as a comparison with similar homes in the area
Home Values in the Area
Average Home Value in this Area
Purchase History
| Date | Buyer | Sale Price | Title Company |
|---|---|---|---|
| Johnson Kristi Racquel | -- | Vanguard Title Orem | |
| Johnson Travis Scott | -- | Vanguard Title Orem | |
| The Kristi Racquel Johnson Trust | -- | Keystone Title Ins Agcy Orem | |
| Johnson Travis Scott | -- | Keystone Title Ins Agcy Orem | |
| Johnson Kristi Racquel | -- | Keystone Title Ins Agcy Llc | |
| Johnson Travis Scott | -- | Keystone Title Ins Agcy Llc | |
| Johnson Kristi Racquel | -- | None Available | |
| Johnson Travis S | -- | Guardian Title | |
| Roman Land Holdings Llc | -- | None Available | |
| Deseret Sky Development Llc | -- | Brighton Title | |
| Deseret Sky Development Llc | -- | Brighton Title | |
| Deseret Sky Development Llc | -- | Accommodation | |
| Naylor Farms Estates Llc | -- | Brighton Title | |
| Deseret Sky Development Llc | -- | Brighton Title |
Source: Public Records
Mortgage History
| Date | Status | Borrower | Loan Amount |
|---|---|---|---|
| Open | Johnson Travis Scott | $350,000 | |
| Closed | Johnson Travis Scott | $365,000 | |
| Closed | Johnson Travis Scott | $383,488 | |
| Closed | Johnson Travis S | $392,656 | |
| Previous Owner | Deseret Sky Development Llc | $527,900 |
Source: Public Records
Tax History Compared to Growth
Tax History
| Year | Tax Paid | Tax Assessment Tax Assessment Total Assessment is a certain percentage of the fair market value that is determined by local assessors to be the total taxable value of land and additions on the property. | Land | Improvement |
|---|---|---|---|---|
| 2025 | $4,155 | $872,900 | $198,500 | $674,400 |
| 2024 | $4,155 | $799,400 | $184,200 | $615,200 |
| 2023 | $4,243 | $769,300 | $178,900 | $590,400 |
| 2022 | $4,409 | $786,600 | $175,400 | $611,200 |
| 2021 | $3,398 | $551,800 | $133,900 | $417,900 |
| 2020 | $3,287 | $501,000 | $129,700 | $371,300 |
| 2019 | $3,113 | $465,200 | $129,700 | $335,500 |
| 2018 | $2,922 | $433,100 | $129,700 | $303,400 |
| 2017 | $2,773 | $409,300 | $106,100 | $303,200 |
| 2016 | $2,897 | $401,700 | $106,100 | $295,600 |
| 2015 | $2,881 | $389,500 | $108,100 | $281,400 |
| 2014 | $2,676 | $356,200 | $100,000 | $256,200 |
Source: Public Records
Map
Nearby Homes
- 3750 W Bingham Creek Dr
- 9375 S Laurel Ridge Cir
- 3702 W Angus Dr
- 9441 S Newkirk St
- 8941 S Sun Leaf Dr
- 3931 W Dansere Cir
- 3888 W 8700 S
- 9526 Ember Glow Ct Unit C
- 9353 S 4460 W
- 9029 S Ripple Dr
- 9566 Ember Glow Ct Unit C
- 4424 W Skye Dr
- 4565 Lennox Dr
- 9871 S 4000 W
- 8400 S 4000 W Unit 134
- 4624 Pine Crossing Dr
- 3965 Dundee St
- 4707 W Granada Hills Ct
- 9941 Birnam Woods Way
- 3256 Star Fire Rd
- 3959 Winthrope Dr
- 3959 W Winthrope Dr
- 3933 Winthrope Dr
- 3933 W Winthrope Dr
- 3973 Winthrope Dr
- 3921 Winthrope Dr
- 3921 W Winthrope Dr Unit Lot 28
- 3921 W Winthrope Dr
- 3948 W Winthrope Dr
- 3948 Winthrope Dr
- 3948 Winthrope Dr Unit LOT 35
- 3936 Winthrope Dr
- 3936 W Winthrope Dr
- 3962 W Winthrope Dr
- 3962 W Winthrope Dr
- 3924 W Winthrope Dr
- 3924 W Winthrope Dr Unit 37
- 3924 W Winthrope Dr
- 3987 W Winthrope Dr
- 3987 W Winthrope Dr