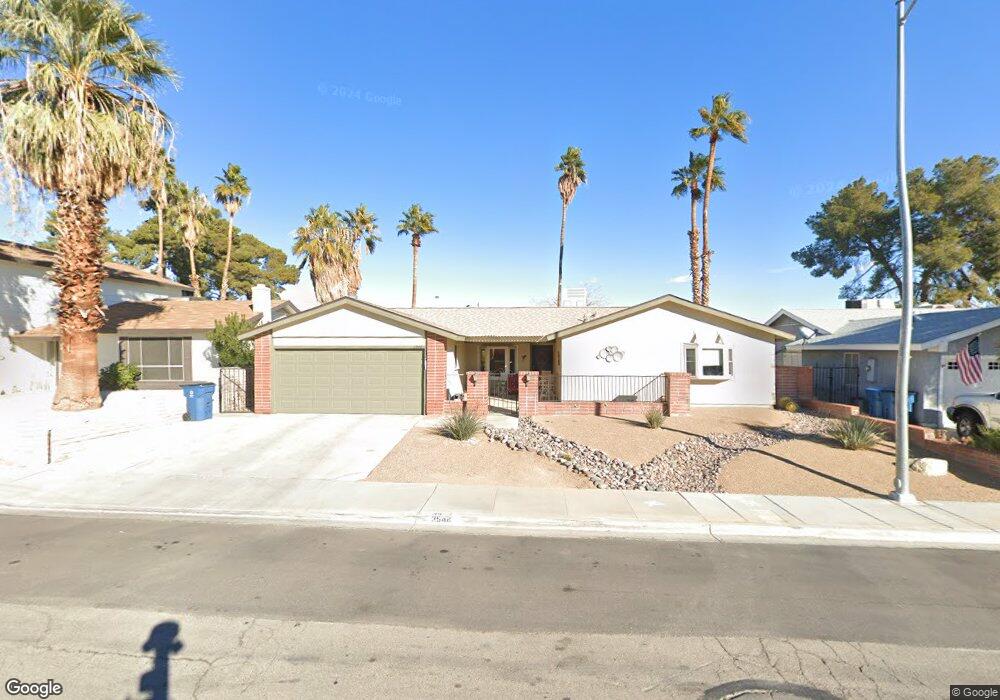
3948 Avonwood Ave Las Vegas, NV 89121
Paradise Valley East NeighborhoodEstimated Value: $405,000 - $441,141
3
Beds
2
Baths
1,840
Sq Ft
$233/Sq Ft
Est. Value
About This Home
This home is located at 3948 Avonwood Ave, Las Vegas, NV 89121 and is currently estimated at $428,035, approximately $232 per square foot. 3948 Avonwood Ave is a home located in Clark County with nearby schools including George E. Harris Elementary School, C.W. Woodbury Middle School, and Chaparral High School.
Ownership History
Date
Name
Owned For
Owner Type
Purchase Details
Closed on
Oct 18, 2013
Sold by
Novak Michael Charles and Novak Jill A
Bought by
Novak Michael Charles and Novak Jill A
Current Estimated Value
Home Financials for this Owner
Home Financials are based on the most recent Mortgage that was taken out on this home.
Original Mortgage
$90,775
Interest Rate
4.46%
Mortgage Type
New Conventional
Purchase Details
Closed on
Jan 31, 2011
Sold by
Novak Michael Charles and Novak Jill A
Bought by
Novak Michael Charles and Novak Jill A
Purchase Details
Closed on
Apr 23, 1999
Sold by
Novak Michael C
Bought by
Johnson Jill A
Home Financials for this Owner
Home Financials are based on the most recent Mortgage that was taken out on this home.
Original Mortgage
$119,816
Interest Rate
7.97%
Mortgage Type
FHA
Purchase Details
Closed on
Aug 7, 1996
Sold by
Novak Leslie A
Bought by
Novak Michael C
Purchase Details
Closed on
Jul 17, 1996
Sold by
Zingalie Edward A and Zingalie Margaret R
Bought by
Novak Michael C
Create a Home Valuation Report for This Property
The Home Valuation Report is an in-depth analysis detailing your home's value as well as a comparison with similar homes in the area
Home Values in the Area
Average Home Value in this Area
Purchase History
| Date | Buyer | Sale Price | Title Company |
|---|---|---|---|
| Novak Michael Charles | -- | Title Source Inc | |
| Novak Michael Charles | -- | Title Source Inc | |
| Novak Michael Charles | -- | None Available | |
| Novak Michael Charles | -- | None Available | |
| Johnson Jill A | $120,000 | Old Republic Title Company | |
| Novak Michael C | -- | Old Republic Title Company | |
| Novak Michael C | $37,500 | Old Republic Title Company |
Source: Public Records
Mortgage History
| Date | Status | Borrower | Loan Amount |
|---|---|---|---|
| Closed | Novak Michael Charles | $90,775 | |
| Previous Owner | Johnson Jill A | $119,816 |
Source: Public Records
Tax History Compared to Growth
Tax History
| Year | Tax Paid | Tax Assessment Tax Assessment Total Assessment is a certain percentage of the fair market value that is determined by local assessors to be the total taxable value of land and additions on the property. | Land | Improvement |
|---|---|---|---|---|
| 2025 | $1,110 | $61,024 | $33,250 | $27,774 |
| 2024 | $1,078 | $61,024 | $33,250 | $27,774 |
| 2023 | $1,183 | $59,690 | $34,650 | $25,040 |
| 2022 | $1,063 | $51,412 | $27,650 | $23,762 |
| 2021 | $1,063 | $48,147 | $24,850 | $23,297 |
| 2020 | $1,029 | $48,328 | $24,500 | $23,828 |
| 2019 | $1,016 | $45,172 | $21,000 | $24,172 |
| 2018 | $970 | $42,053 | $18,200 | $23,853 |
| 2017 | $1,291 | $44,029 | $19,250 | $24,779 |
| 2016 | $1,183 | $39,614 | $13,650 | $25,964 |
| 2015 | $906 | $37,408 | $11,200 | $26,208 |
| 2014 | $880 | $32,821 | $8,400 | $24,421 |
Source: Public Records
Map
Nearby Homes
- 4021 Avonwood Ave
- 3896 Maryland Ave
- 4000 E Twain Ave
- 4030 E Twain Ave
- 3635 Rosewood Dr
- 4770 S Topaz St Unit 31
- 3822 Don Carlos Dr
- 3464 Monte Carlo Dr
- 3795 Heritage Ave
- 3789 Heritage Ave
- 3688 Edison Ave
- 3673 Castille St
- 3755 Chutney St
- 3667 Descanso St
- 3412 Townhouse Dr
- 3933 Edgemoor Way
- 3950 S Sandhill Rd Unit 103
- 3950 S Sandhill Rd Unit 132
- 3950 S Sandhill Rd Unit 130
- 3954 Edgemoor Way
- 3938 Avonwood Ave
- 3958 Avonwood Ave
- 3945 Cherokee Ave E
- 3955 Cherokee Ave E
- 3935 Cherokee Ave E
- 3968 Avonwood Ave
- 3951 Avonwood Ave
- 3941 Avonwood Ave
- 3965 Cherokee Ave E
- 3925 Cherokee Ave E
- 3925 E Cherokee Ave
- 3961 Avonwood Ave
- 3918 Avonwood Ave
- 3976 Avonwood Ave
- 3973 Cherokee Ave E
- 3971 Avonwood Ave
- 3915 Cherokee Ave E
- 3921 Avonwood Ave