Estimated Value: $432,000 - $504,000
Studio
--
Bath
1,748
Sq Ft
$268/Sq Ft
Est. Value
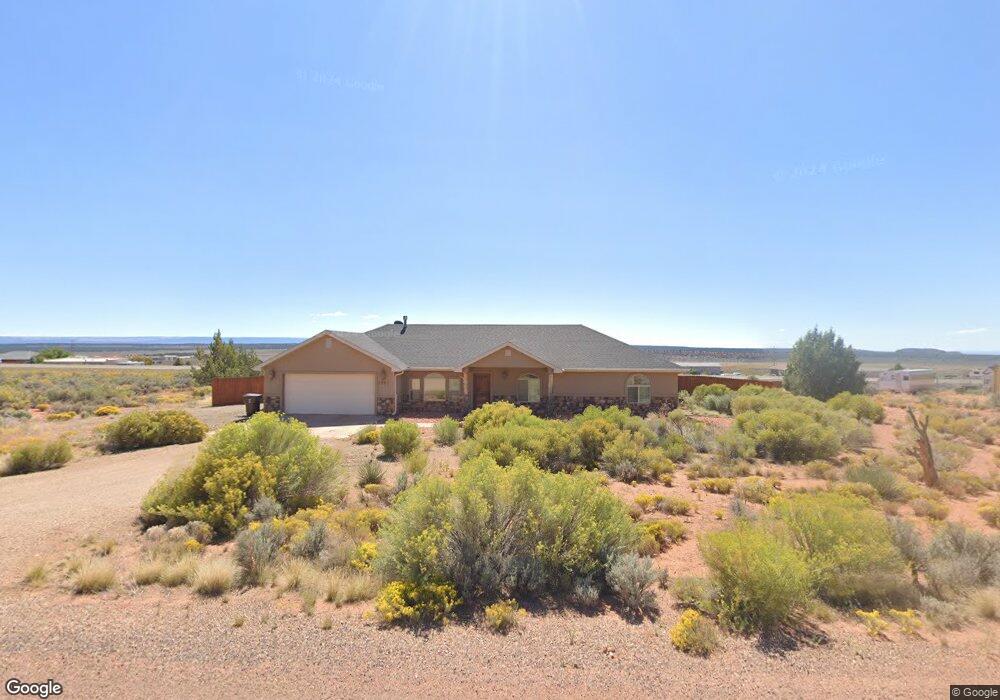
About This Home
This home is located at 3948 E Juniper Cliffs Dr, Kanab, UT 84741 and is currently estimated at $468,353, approximately $267 per square foot. 3948 E Juniper Cliffs Dr is a home located in Kane County with nearby schools including Kanab Elementary School, Kanab Middle School, and Kanab High School.
Ownership History
Date
Name
Owned For
Owner Type
Purchase Details
Closed on
Jul 9, 2015
Sold by
Justin G Justin G and Perkins Chelsea
Bought by
Stein Amy
Current Estimated Value
Purchase Details
Closed on
Sep 27, 2012
Sold by
Perkins Justin G
Bought by
Perkins Justin and Perkins Chelsea
Home Financials for this Owner
Home Financials are based on the most recent Mortgage that was taken out on this home.
Original Mortgage
$194,900
Outstanding Balance
$135,470
Interest Rate
3.59%
Estimated Equity
$332,883
Purchase Details
Closed on
Jul 17, 2007
Sold by
Perkins Justin and Perkins Chelsea
Bought by
Perkins Justin G
Purchase Details
Closed on
Feb 12, 2007
Sold by
Tietjen Rosanne
Bought by
Kane County
Purchase Details
Closed on
Jan 18, 2007
Sold by
Tietjen Rosanne
Bought by
Perkins Justin and Perkins Chelsea
Purchase Details
Closed on
Oct 21, 2005
Sold by
Seese Philip A and Seese Roberta
Bought by
Tietjen Rosanne
Home Financials for this Owner
Home Financials are based on the most recent Mortgage that was taken out on this home.
Original Mortgage
$16,500
Interest Rate
5.67%
Create a Home Valuation Report for This Property
The Home Valuation Report is an in-depth analysis detailing your home's value as well as a comparison with similar homes in the area
Purchase History
| Date | Buyer | Sale Price | Title Company |
|---|---|---|---|
| Stein Amy | -- | -- | |
| Perkins Justin | -- | -- | |
| Perkins Justin G | -- | -- | |
| Kane County | -- | -- | |
| Perkins Justin | -- | -- | |
| Tietjen Rosanne | -- | -- |
Source: Public Records
Mortgage History
| Date | Status | Borrower | Loan Amount |
|---|---|---|---|
| Open | Perkins Justin | $194,900 | |
| Previous Owner | Tietjen Rosanne | $16,500 |
Source: Public Records
Tax History
| Year | Tax Paid | Tax Assessment Tax Assessment Total Assessment is a certain percentage of the fair market value that is determined by local assessors to be the total taxable value of land and additions on the property. | Land | Improvement |
|---|---|---|---|---|
| 2025 | $1,754 | $463,501 | $119,191 | $344,310 |
| 2024 | $1,689 | $243,331 | $64,975 | $178,356 |
| 2023 | $1,394 | $213,366 | $60,162 | $153,204 |
| 2022 | $1,418 | $192,018 | $38,814 | $153,204 |
| 2021 | $1,281 | $260,620 | $54,285 | $206,335 |
| 2020 | $1,312 | $257,619 | $56,347 | $201,272 |
| 2019 | $1,350 | $257,619 | $56,347 | $201,272 |
| 2018 | $1,219 | $230,565 | $46,956 | $183,609 |
| 2017 | $1,090 | $197,471 | $36,120 | $161,351 |
| 2016 | $1,062 | $187,240 | $30,100 | $157,140 |
| 2015 | $911 | $169,855 | $30,100 | $139,755 |
| 2014 | $911 | $160,123 | $39,123 | $121,000 |
| 2013 | -- | $88,068 | $0 | $0 |
Source: Public Records
Map
Nearby Homes
- 3976 Juniper Cliffs Dr
- 3770 E Juniper Cliffs Dr
- 1286 S Knoll
- 1286 S Knoll Unit 6-191
- Lot 10 Silver Dawn Cir
- 4395 E Mountain View Dr Unit C-77
- 4225 Blue Sky
- 4441 Red Cliffs Dr
- Lot 30 Mule Deer Cir
- 4210 Star Gazer Cir
- 4377 E Colt Cir
- 4377/4375 E Colt Cir
- 4225 E Star Gazer Cir
- 4210 E Milky Way Cir
- 47 Sego Lilly Cir
- 4380 E Sego Lily Cir
- 50 Milky Way
- 51 Milky Way Cir
- 51 Milky Way
- 1448 S Sage Ct
- 3920 E Juniper Cliffs Dr
- 4010 E Juniper Cliffs Dr
- 3915 E Juniper Cliffs Dr
- 3939 E Juniper Cliffs Dr
- 0 Lot 55 Unit 1408882
- 0 Lot 55 Unit 1408881
- 4015 E Mountain View Dr
- 3925 E Mountain View Dr
- 3895 E Juniper Cliffs Dr
- 3875 E Juniper Cliffs Dr
- 0 E Juniper Cliffs Dr Unit 22-233967
- 0 E Juniper Cliffs Dr Unit 20-217583
- 0 E Juniper Cliffs Dr Unit 39 1829561
- 1380 S Pine Cliffs Dr
- 3841 E Juniper Cliffs Dr
- 0 E Mountain View Dr Unit 1409232
- 0 E Mountain View Dr Unit 1409046
- 0 E Mountain View Dr Unit 13-145844
- 0 E Mountain View Dr Unit 12-137134
- 4132 E Mountain View Dr
Your Personal Tour Guide
Ask me questions while you tour the home.