Estimated Value: $667,000 - $744,361
3
Beds
4
Baths
4,989
Sq Ft
$141/Sq Ft
Est. Value
About This Home
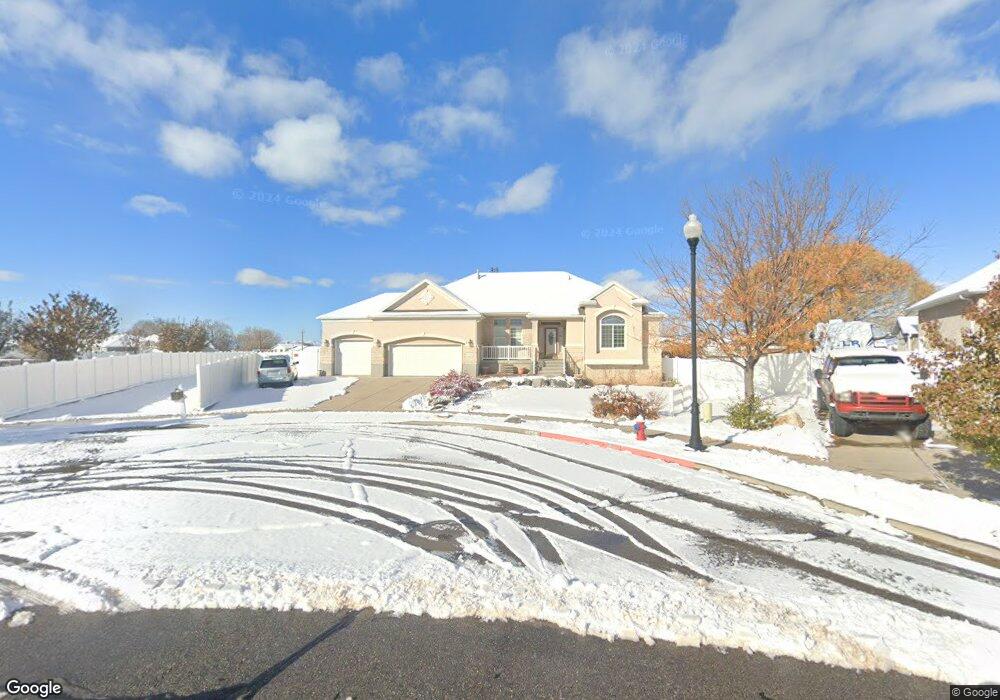
This home is located at 3948 W 6050 S, Roy, UT 84067 and is currently estimated at $705,590, approximately $141 per square foot. 3948 W 6050 S is a home located in Weber County with nearby schools including Freedom School, Roy Junior High School, and Roy High School.
Ownership History
Date
Name
Owned For
Owner Type
Purchase Details
Closed on
Feb 22, 2019
Sold by
Hatch Joel R and Hatch Christine D
Bought by
Hatch Joel R and Hatch Christine D
Current Estimated Value
Purchase Details
Closed on
Nov 1, 2017
Sold by
Hogenson Michel R and Hogenson Evalngeline E
Bought by
Hatch Joel R and Hatch Christine D
Home Financials for this Owner
Home Financials are based on the most recent Mortgage that was taken out on this home.
Original Mortgage
$253,600
Outstanding Balance
$212,392
Interest Rate
3.83%
Mortgage Type
New Conventional
Estimated Equity
$493,198
Purchase Details
Closed on
Mar 7, 2005
Sold by
Gmw Development Inc
Bought by
Hogenson Michael R and Hogenson Evangeline E
Home Financials for this Owner
Home Financials are based on the most recent Mortgage that was taken out on this home.
Original Mortgage
$343,715
Interest Rate
5.66%
Mortgage Type
Fannie Mae Freddie Mac
Create a Home Valuation Report for This Property
The Home Valuation Report is an in-depth analysis detailing your home's value as well as a comparison with similar homes in the area
Home Values in the Area
Average Home Value in this Area
Purchase History
| Date | Buyer | Sale Price | Title Company |
|---|---|---|---|
| Hatch Joel R | -- | None Available | |
| Hatch Joel R | -- | Mountain View Title | |
| Hogenson Michael R | -- | Cottonwood Title Insurance A |
Source: Public Records
Mortgage History
| Date | Status | Borrower | Loan Amount |
|---|---|---|---|
| Open | Hatch Joel R | $253,600 | |
| Previous Owner | Hogenson Michael R | $343,715 |
Source: Public Records
Tax History
| Year | Tax Paid | Tax Assessment Tax Assessment Total Assessment is a certain percentage of the fair market value that is determined by local assessors to be the total taxable value of land and additions on the property. | Land | Improvement |
|---|---|---|---|---|
| 2025 | $4,639 | $757,781 | $192,726 | $565,055 |
| 2024 | $4,524 | $409,198 | $105,999 | $303,199 |
| 2023 | $4,556 | $414,149 | $104,906 | $309,243 |
| 2022 | $5,063 | $473,550 | $71,244 | $402,306 |
| 2021 | $4,090 | $629,000 | $88,188 | $540,812 |
| 2020 | $3,611 | $507,000 | $88,188 | $418,812 |
| 2019 | $3,422 | $453,000 | $72,296 | $380,704 |
| 2018 | $3,750 | $474,001 | $67,291 | $406,710 |
| 2017 | $3,383 | $401,000 | $64,286 | $336,714 |
| 2016 | $3,041 | $193,355 | $36,557 | $156,798 |
| 2015 | $2,735 | $178,221 | $33,775 | $144,446 |
| 2014 | $2,757 | $178,222 | $33,775 | $144,447 |
Source: Public Records
Map
Nearby Homes
Your Personal Tour Guide
Ask me questions while you tour the home.