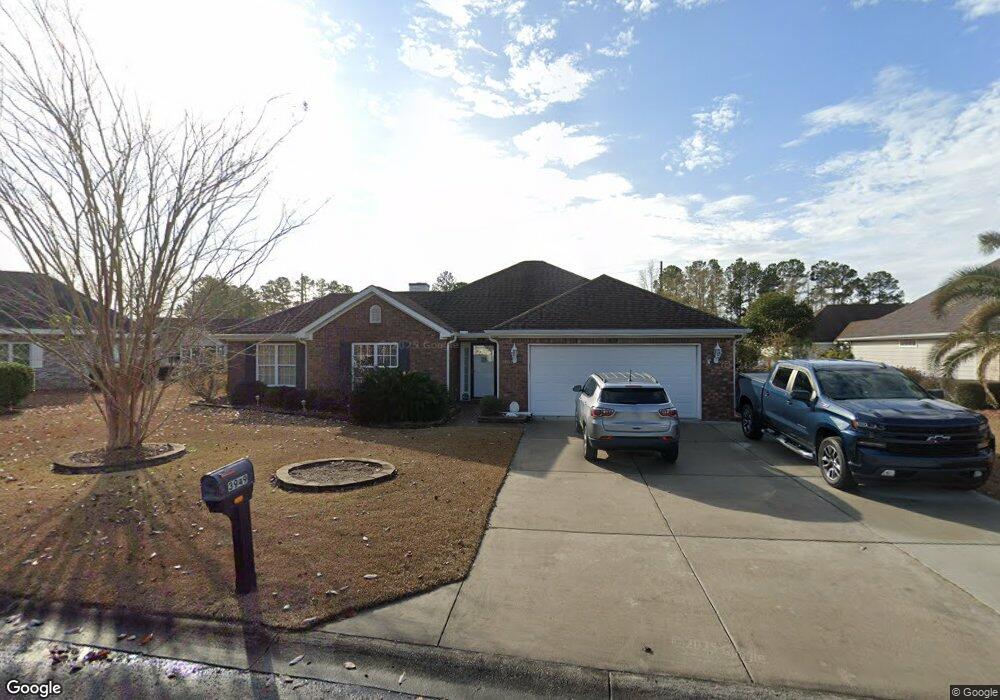
3949 Sandringham Ct Unit Glenmere Myrtle Beach, SC 29588
Estimated Value: $348,000 - $370,000
2
Beds
2
Baths
1,852
Sq Ft
$191/Sq Ft
Est. Value
About This Home
This home is located at 3949 Sandringham Ct Unit Glenmere, Myrtle Beach, SC 29588 and is currently estimated at $354,621, approximately $191 per square foot. 3949 Sandringham Ct Unit Glenmere is a home located in Horry County with nearby schools including Lakewood Elementary, Socastee Middle, and Socastee High School.
Ownership History
Date
Name
Owned For
Owner Type
Purchase Details
Closed on
Aug 2, 2016
Sold by
Rhodes Debra M
Bought by
Lucas Jeffrey L
Current Estimated Value
Home Financials for this Owner
Home Financials are based on the most recent Mortgage that was taken out on this home.
Original Mortgage
$90,000
Outstanding Balance
$71,647
Interest Rate
3.41%
Mortgage Type
New Conventional
Estimated Equity
$282,974
Purchase Details
Closed on
Feb 24, 2015
Sold by
Reep Esther H
Bought by
Rhodes Debra M
Purchase Details
Closed on
Nov 24, 2010
Sold by
Lemay Barbara H
Bought by
Reep Esther Hastings
Purchase Details
Closed on
Dec 9, 2004
Sold by
Ciacciullo Michael A
Bought by
Lemay Barbara H
Purchase Details
Closed on
Aug 29, 2001
Sold by
Doran Michael J and Doran Robin
Bought by
Ciacciullo Michael A
Home Financials for this Owner
Home Financials are based on the most recent Mortgage that was taken out on this home.
Original Mortgage
$134,800
Interest Rate
6.98%
Mortgage Type
Construction
Create a Home Valuation Report for This Property
The Home Valuation Report is an in-depth analysis detailing your home's value as well as a comparison with similar homes in the area
Home Values in the Area
Average Home Value in this Area
Purchase History
| Date | Buyer | Sale Price | Title Company |
|---|---|---|---|
| Lucas Jeffrey L | $180,000 | -- | |
| Rhodes Debra M | -- | -- | |
| Reep Esther Hastings | $175,000 | -- | |
| Lemay Barbara H | $219,900 | -- | |
| Ciacciullo Michael A | $33,500 | -- |
Source: Public Records
Mortgage History
| Date | Status | Borrower | Loan Amount |
|---|---|---|---|
| Open | Lucas Jeffrey L | $90,000 | |
| Previous Owner | Ciacciullo Michael A | $134,800 |
Source: Public Records
Tax History Compared to Growth
Tax History
| Year | Tax Paid | Tax Assessment Tax Assessment Total Assessment is a certain percentage of the fair market value that is determined by local assessors to be the total taxable value of land and additions on the property. | Land | Improvement |
|---|---|---|---|---|
| 2024 | -- | $14,547 | $3,269 | $11,278 |
| 2023 | $0 | $7,966 | $1,414 | $6,552 |
| 2021 | $843 | $8,145 | $1,529 | $6,616 |
| 2020 | $738 | $8,145 | $1,529 | $6,616 |
| 2019 | $738 | $8,145 | $1,529 | $6,616 |
| 2018 | $0 | $6,928 | $1,224 | $5,704 |
| 2017 | $2,239 | $10,391 | $1,835 | $8,556 |
| 2016 | $0 | $10,391 | $1,835 | $8,556 |
| 2015 | -- | $6,928 | $1,224 | $5,704 |
| 2014 | $29 | $6,928 | $1,224 | $5,704 |
Source: Public Records
Map
Nearby Homes
- 3888 Stillwood Dr
- 4096 Grousewood Dr
- 3990 Lochview Dr
- 156 MacHrie Loop Unit A
- 3910 Stillwood Dr
- 357 Cabo Loop
- 147 MacHrie Loop Unit D
- 188 MacHrie Loop Unit C
- 196 MacHrie Loop Unit A
- 1416 Castleberry Place
- 115 MacHrie Loop Unit D
- 775 Oyster Bluff Dr
- 2017 Sage Dr Unit Lot 144 Oyster Bluff
- 275 Saint David's Ave
- 100 MacHrie Loop Unit C
- 249 Cabo Loop
- 220 MacHrie Loop Unit A
- 636 Black Pearl Way
- 645 Black Pearl Way
- 280 Hidden Woods Dr
- 3949 Sandringham Ct
- 3951 Sandringham Ct
- 3947 Sandringham Ct
- 4028 Grousewood Dr
- 4024 Grousewood Dr
- 4030 Grousewood Dr
- 4022 Grousewood Dr
- 3953 Sandringham Ct
- 4032 Grousewood Dr Unit Glenmere
- 4032 Grousewood Dr
- 4018 Grousewood Dr
- 3755 Sandringham Dr
- 3753 Sandringham Dr
- 3753 Sandringham Dr Unit Glenmere III
- 4027 Grousewood Dr
- 3757 Sandringham Dr
- 4025 Grousewood Dr
- 3751 Sandringham Dr
- 3955 Sandringham Ct
- 4034 Grousewood Dr