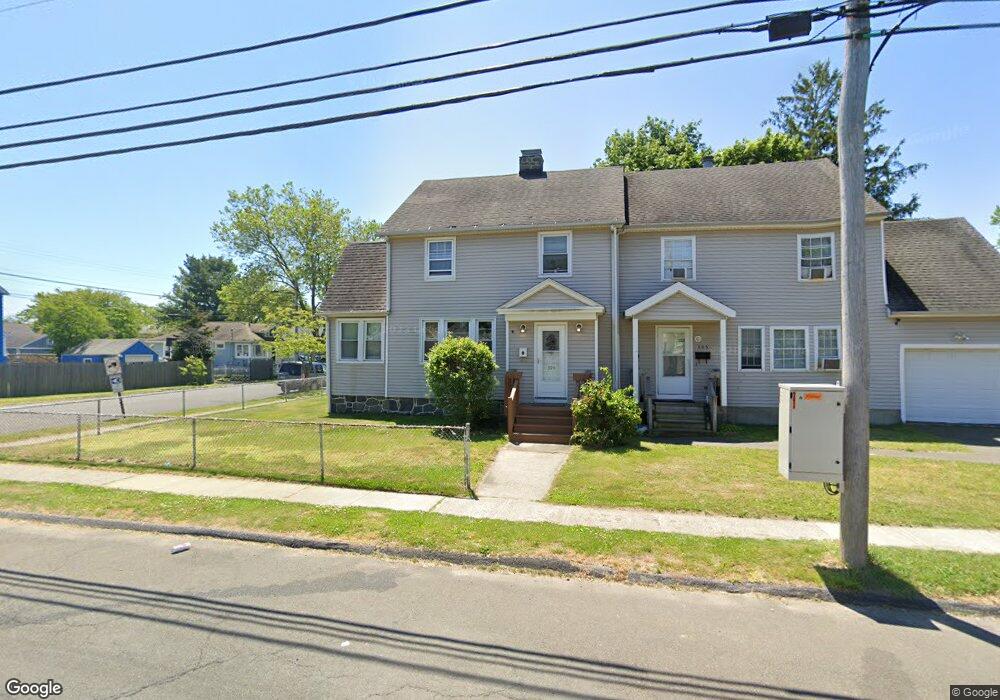
395 Birdseye St Stratford, CT 06615
Stratford Center Historic District NeighborhoodEstimated Value: $363,000 - $408,000
3
Beds
2
Baths
1,499
Sq Ft
$260/Sq Ft
Est. Value
About This Home
This home is located at 395 Birdseye St, Stratford, CT 06615 and is currently estimated at $390,269, approximately $260 per square foot. 395 Birdseye St is a home located in Fairfield County with nearby schools including Stratford Academy - Johnson House, David Wooster Middle School, and Stratford High School.
Ownership History
Date
Name
Owned For
Owner Type
Purchase Details
Closed on
Aug 29, 2007
Sold by
Mosher Benjamin and Mosher Martha
Bought by
Jones Joseph and Jones Tekenyia
Current Estimated Value
Home Financials for this Owner
Home Financials are based on the most recent Mortgage that was taken out on this home.
Original Mortgage
$235,275
Outstanding Balance
$149,345
Interest Rate
6.71%
Estimated Equity
$240,924
Purchase Details
Closed on
May 1, 2000
Sold by
Gracobbe Joseph
Bought by
Mosher Benjamin M and Mosher Martha J
Home Financials for this Owner
Home Financials are based on the most recent Mortgage that was taken out on this home.
Original Mortgage
$104,900
Interest Rate
8.23%
Purchase Details
Closed on
Mar 24, 1998
Sold by
Mcgrath Mildred Est
Bought by
Giacobbe Joseph
Create a Home Valuation Report for This Property
The Home Valuation Report is an in-depth analysis detailing your home's value as well as a comparison with similar homes in the area
Home Values in the Area
Average Home Value in this Area
Purchase History
| Date | Buyer | Sale Price | Title Company |
|---|---|---|---|
| Jones Joseph | $245,000 | -- | |
| Mosher Benjamin M | $125,000 | -- | |
| Giacobbe Joseph | $50,000 | -- |
Source: Public Records
Mortgage History
| Date | Status | Borrower | Loan Amount |
|---|---|---|---|
| Open | Giacobbe Joseph | $235,275 | |
| Previous Owner | Giacobbe Joseph | $150,000 | |
| Previous Owner | Giacobbe Joseph | $110,500 | |
| Previous Owner | Giacobbe Joseph | $104,900 |
Source: Public Records
Tax History Compared to Growth
Tax History
| Year | Tax Paid | Tax Assessment Tax Assessment Total Assessment is a certain percentage of the fair market value that is determined by local assessors to be the total taxable value of land and additions on the property. | Land | Improvement |
|---|---|---|---|---|
| 2025 | $5,846 | $145,430 | $47,710 | $97,720 |
| 2024 | $5,846 | $145,430 | $47,710 | $97,720 |
| 2023 | $5,846 | $145,430 | $47,710 | $97,720 |
| 2022 | $5,739 | $145,430 | $47,710 | $97,720 |
| 2021 | $5,740 | $145,430 | $47,710 | $97,720 |
| 2020 | $5,765 | $145,430 | $47,710 | $97,720 |
| 2019 | $4,062 | $101,890 | $32,240 | $69,650 |
| 2018 | $4,065 | $101,890 | $32,240 | $69,650 |
| 2017 | $4,073 | $101,890 | $32,240 | $69,650 |
| 2016 | $3,973 | $101,890 | $32,240 | $69,650 |
| 2015 | $3,768 | $101,890 | $32,240 | $69,650 |
| 2014 | $4,033 | $113,190 | $31,360 | $81,830 |
Source: Public Records
Map
Nearby Homes
- 291 Birdseye St
- 209 Mcgrath Ct
- 1170 South Ave
- 1260 Elm St
- 1460 Elm St Unit 322
- 79 Wooster Ave
- 50 Birdseye St Unit 101
- 50 Birdseye St Unit 104
- 32 Harbour View Place
- 88 Boswell St
- 909 Main St
- 1198 Wells Place
- 270 Roosevelt Ave
- 366 Columbus Ave
- 107 Dewey St
- 5 Lindsley Place
- 325 Mckinley Ave
- 1867 Main St
- 216 Mckinley Ave
- 394 Harding Ave