Estimated Value: $158,000 - $226,000
--
Bed
1
Bath
1,248
Sq Ft
$146/Sq Ft
Est. Value
About This Home
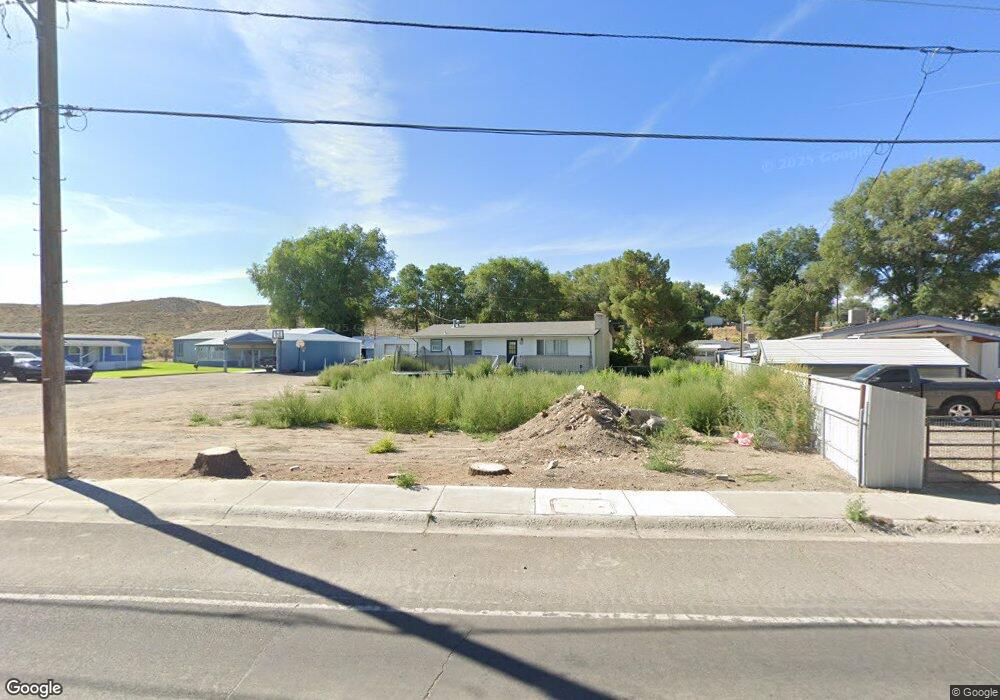
This home is located at 395 Bullion Rd, Elko, NV 89801 and is currently estimated at $182,687, approximately $146 per square foot. 395 Bullion Rd is a home with nearby schools including Southside Elementary School, Flagview Intermediate School, and Adobe Middle School.
Ownership History
Date
Name
Owned For
Owner Type
Purchase Details
Closed on
Dec 18, 2024
Sold by
Smith Jeff Houston and Smith Nicole Lynn
Bought by
Graser Joel W
Current Estimated Value
Purchase Details
Closed on
Feb 13, 2024
Sold by
Elko County Treasurer
Bought by
Smith Nicole Lynn and Smith Jeff Houston
Purchase Details
Closed on
Jun 5, 2023
Sold by
Elko County Treasurer
Bought by
Elko County Treasurer
Purchase Details
Closed on
Dec 19, 2019
Sold by
Regan Brunella and Lewis Brunella
Bought by
Smith Jeff Houston and Smith Nicole Lynn
Create a Home Valuation Report for This Property
The Home Valuation Report is an in-depth analysis detailing your home's value as well as a comparison with similar homes in the area
Home Values in the Area
Average Home Value in this Area
Purchase History
| Date | Buyer | Sale Price | Title Company |
|---|---|---|---|
| Graser Joel W | $149,500 | None Listed On Document | |
| Smith Nicole Lynn | $7,687 | None Listed On Document | |
| Elko County Treasurer | $5,373 | None Listed On Document | |
| Smith Jeff Houston | $175,000 | Wfg National Title Co Of Nv | |
| Regan Brunella | -- | Wfg Natl Ttl Co Of Necada |
Source: Public Records
Tax History Compared to Growth
Tax History
| Year | Tax Paid | Tax Assessment Tax Assessment Total Assessment is a certain percentage of the fair market value that is determined by local assessors to be the total taxable value of land and additions on the property. | Land | Improvement |
|---|---|---|---|---|
| 2025 | $1,677 | $52,163 | $25,025 | $27,138 |
| 2024 | $1,677 | $47,122 | $18,798 | $28,324 |
| 2023 | $1,605 | $44,984 | $18,798 | $26,186 |
| 2022 | $1,486 | $40,548 | $18,798 | $21,750 |
| 2021 | $1,443 | $39,561 | $18,798 | $20,763 |
| 2020 | $1,371 | $39,341 | $18,798 | $20,543 |
| 2019 | $1,335 | $38,319 | $18,798 | $19,521 |
| 2018 | $1,110 | $31,852 | $11,480 | $20,372 |
| 2017 | $1,123 | $32,230 | $11,480 | $20,750 |
| 2016 | $1,159 | $34,046 | $11,480 | $22,566 |
| 2015 | $1,186 | $34,205 | $11,480 | $22,725 |
| 2014 | $1,192 | $33,858 | $11,480 | $22,378 |
Source: Public Records
Map
Nearby Homes