Estimated Value: $627,000 - $735,000
4
Beds
2
Baths
1,472
Sq Ft
$454/Sq Ft
Est. Value
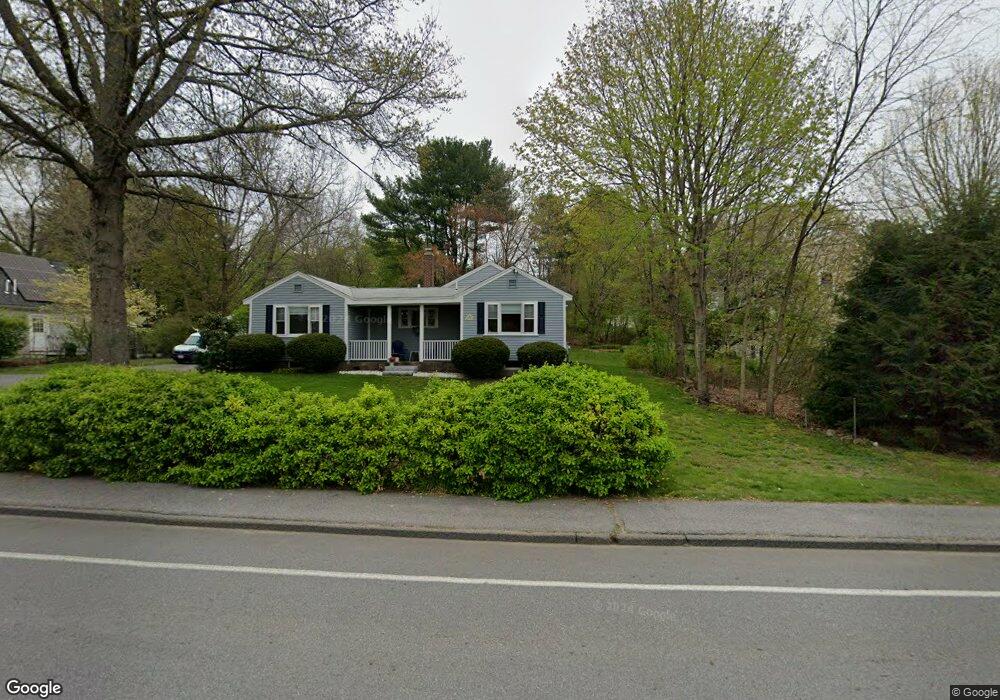
About This Home
This home is located at 395 Central St, Acton, MA 01720 and is currently estimated at $667,677, approximately $453 per square foot. 395 Central St is a home located in Middlesex County with nearby schools including Acton-Boxborough Regional High School and Oak Meadow Montessori School.
Ownership History
Date
Name
Owned For
Owner Type
Purchase Details
Closed on
Aug 1, 1994
Sold by
Holland David N and Holland Michele B
Bought by
Dee Peter and Dee Carolyn H
Current Estimated Value
Home Financials for this Owner
Home Financials are based on the most recent Mortgage that was taken out on this home.
Original Mortgage
$118,000
Interest Rate
8.25%
Mortgage Type
Purchase Money Mortgage
Create a Home Valuation Report for This Property
The Home Valuation Report is an in-depth analysis detailing your home's value as well as a comparison with similar homes in the area
Home Values in the Area
Average Home Value in this Area
Purchase History
| Date | Buyer | Sale Price | Title Company |
|---|---|---|---|
| Dee Peter | $124,250 | -- |
Source: Public Records
Mortgage History
| Date | Status | Borrower | Loan Amount |
|---|---|---|---|
| Open | Dee Peter | $110,000 | |
| Closed | Dee Peter | $118,000 |
Source: Public Records
Tax History
| Year | Tax Paid | Tax Assessment Tax Assessment Total Assessment is a certain percentage of the fair market value that is determined by local assessors to be the total taxable value of land and additions on the property. | Land | Improvement |
|---|---|---|---|---|
| 2025 | $9,522 | $555,200 | $272,700 | $282,500 |
| 2024 | $9,040 | $542,300 | $272,700 | $269,600 |
| 2023 | $8,766 | $499,200 | $247,800 | $251,400 |
| 2022 | $8,735 | $449,100 | $215,500 | $233,600 |
| 2021 | $8,343 | $412,400 | $199,500 | $212,900 |
| 2020 | $7,821 | $406,500 | $199,500 | $207,000 |
| 2019 | $7,308 | $377,300 | $199,500 | $177,800 |
| 2018 | $6,820 | $351,900 | $199,500 | $152,400 |
| 2017 | $6,795 | $356,500 | $199,500 | $157,000 |
| 2016 | $6,434 | $334,600 | $199,500 | $135,100 |
| 2015 | $6,403 | $336,100 | $199,500 | $136,600 |
| 2014 | $6,424 | $330,300 | $199,500 | $130,800 |
Source: Public Records
Map
Nearby Homes
- 4 Littlefield Rd
- 5 Perkins Ln
- 60 Nashoba Rd
- 235 Arlington St
- 20 Joseph Reed Ln
- 79 Charter Rd
- 92 Willow St Unit 3
- 92 Willow St Unit 2
- 90 Willow St Unit 1
- 246 Main St Unit 2
- 18 Hayward Rd
- 7 Kelley Rd
- 4 Omega Way
- 11 Braebrook
- 184 Main St Unit 3
- 25 Nylander Way
- 46 Taylor Rd
- 33 Meadowbrook Rd
- 79 Old Orchard Ln
- 77 Wheeler Dr Unit 77
Your Personal Tour Guide
Ask me questions while you tour the home.