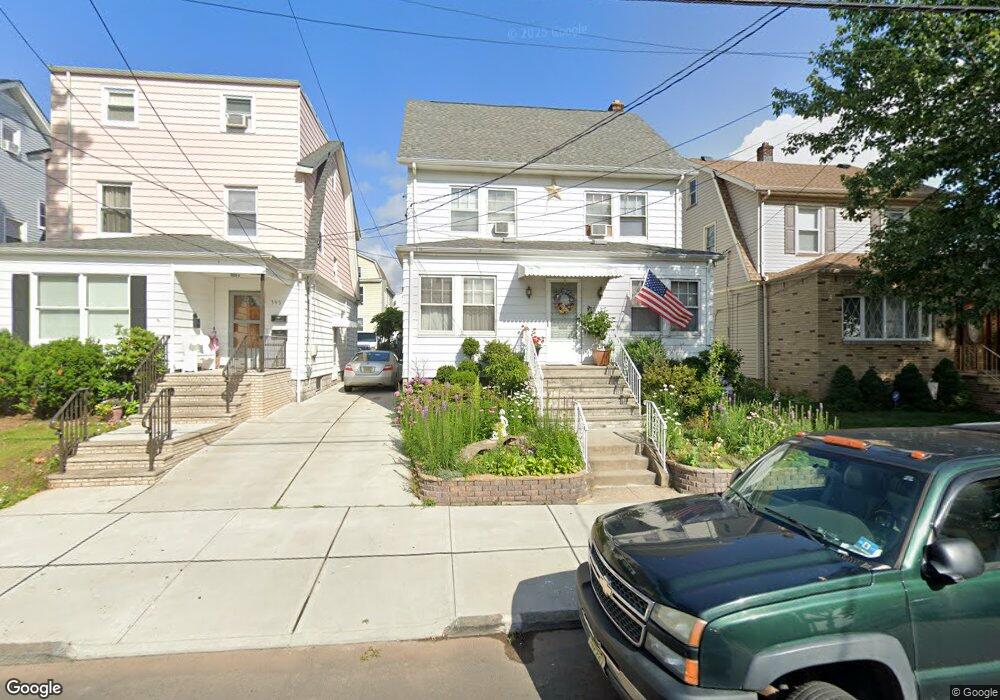
395 Devon St Kearny, NJ 07032
Arlington NeighborhoodEstimated Value: $387,323 - $763,000
Studio
--
Bath
1,638
Sq Ft
$339/Sq Ft
Est. Value
About This Home
This home is located at 395 Devon St, Kearny, NJ 07032 and is currently estimated at $554,831, approximately $338 per square foot. 395 Devon St is a home located in Hudson County with nearby schools including Kearny High School, Hudson Arts and Sciences Charter School, and Kearny Christian Academy.
Ownership History
Date
Name
Owned For
Owner Type
Purchase Details
Closed on
Jul 25, 2011
Sold by
Gomes Armindo
Bought by
Gomes Maria P
Current Estimated Value
Purchase Details
Closed on
May 16, 1994
Sold by
Dvoranchik William
Bought by
Gomes Armindo and Gomes Maria
Home Financials for this Owner
Home Financials are based on the most recent Mortgage that was taken out on this home.
Original Mortgage
$60,000
Interest Rate
8.22%
Create a Home Valuation Report for This Property
The Home Valuation Report is an in-depth analysis detailing your home's value as well as a comparison with similar homes in the area
Home Values in the Area
Average Home Value in this Area
Purchase History
| Date | Buyer | Sale Price | Title Company |
|---|---|---|---|
| Gomes Maria P | -- | -- | |
| Gomes Armindo | $147,000 | -- |
Source: Public Records
Mortgage History
| Date | Status | Borrower | Loan Amount |
|---|---|---|---|
| Previous Owner | Gomes Armindo | $60,000 |
Source: Public Records
Tax History
| Year | Tax Paid | Tax Assessment Tax Assessment Total Assessment is a certain percentage of the fair market value that is determined by local assessors to be the total taxable value of land and additions on the property. | Land | Improvement |
|---|---|---|---|---|
| 2025 | $9,078 | $84,800 | $24,500 | $60,300 |
| 2024 | $8,961 | $84,800 | $24,500 | $60,300 |
| 2023 | $8,961 | $84,800 | $24,500 | $60,300 |
| 2022 | $8,940 | $84,800 | $24,500 | $60,300 |
| 2021 | $8,891 | $84,800 | $24,500 | $60,300 |
| 2020 | $8,896 | $84,800 | $24,500 | $60,300 |
| 2019 | $8,940 | $84,800 | $24,500 | $60,300 |
| 2018 | $8,956 | $84,800 | $24,500 | $60,300 |
| 2017 | $9,078 | $84,800 | $24,500 | $60,300 |
| 2016 | $9,047 | $84,800 | $24,500 | $60,300 |
| 2015 | $8,756 | $84,800 | $24,500 | $60,300 |
| 2014 | $8,511 | $84,800 | $24,500 | $60,300 |
Source: Public Records
Map
Nearby Homes
- 307 Kearny Ave
- 77 Pavonia Ave
- 281 Maple St
- 390 Forest St
- 229 Brighton Ave
- 18 Rutland Ave
- 42 Pavonia Ave
- 425 Davis Ave
- 422 Davis Ave
- 211 Bergen Ave
- 211 Bergen Ave Unit 2
- 53 Oakwood Ave
- 89 Ivy St
- 251 Highland Ave
- 447 Elm St
- 438 Forest St
- 201 Chestnut St
- 84 Brighton Ave
- 161 Midland Ave
- 520 Schuyler Ave
Your Personal Tour Guide
Ask me questions while you tour the home.