Estimated Value: $425,400 - $456,000
3
Beds
2
Baths
1,564
Sq Ft
$284/Sq Ft
Est. Value
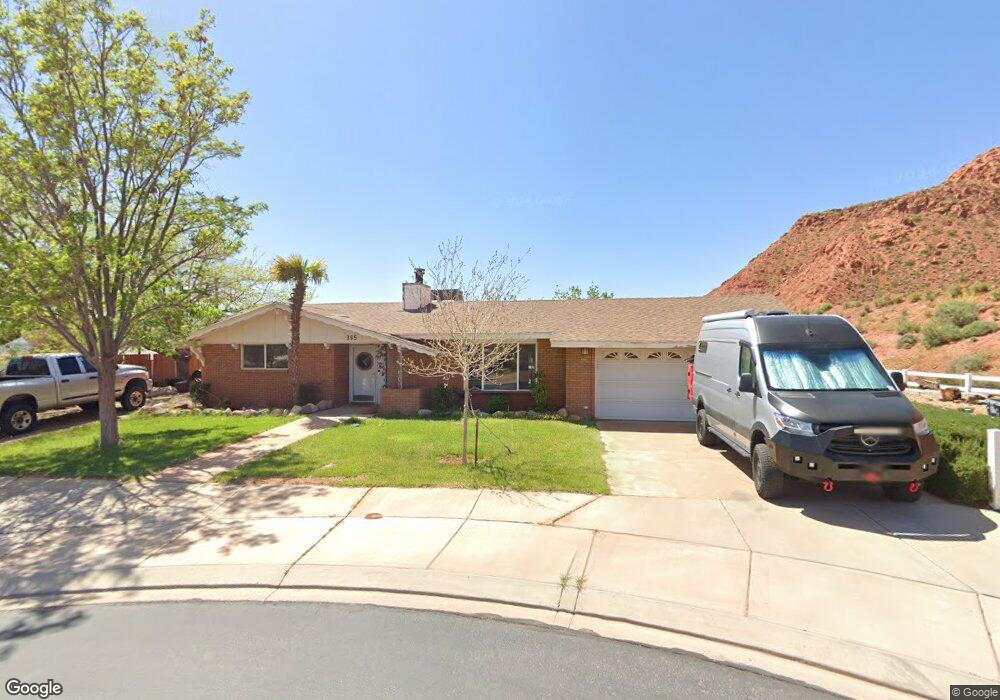
About This Home
This home is located at 395 E 200 S, Ivins, UT 84738 and is currently estimated at $444,600, approximately $284 per square foot. 395 E 200 S is a home located in Washington County with nearby schools including Red Mountain School, Snow Canyon Middle School, and Lava Ridge Intermediate School.
Ownership History
Date
Name
Owned For
Owner Type
Purchase Details
Closed on
Mar 21, 2018
Sold by
Meng Jie
Bought by
Sanders Leland H
Current Estimated Value
Purchase Details
Closed on
Jun 23, 2008
Sold by
Mulliner Dell R and Mulliner Joan M
Bought by
Sanders Leland H and Meng Jie
Home Financials for this Owner
Home Financials are based on the most recent Mortgage that was taken out on this home.
Original Mortgage
$165,000
Interest Rate
5.99%
Mortgage Type
Purchase Money Mortgage
Create a Home Valuation Report for This Property
The Home Valuation Report is an in-depth analysis detailing your home's value as well as a comparison with similar homes in the area
Purchase History
| Date | Buyer | Sale Price | Title Company |
|---|---|---|---|
| Sanders Leland H | -- | None Available | |
| Sanders Leland H | -- | Backman Fptp |
Source: Public Records
Mortgage History
| Date | Status | Borrower | Loan Amount |
|---|---|---|---|
| Previous Owner | Sanders Leland H | $165,000 |
Source: Public Records
Tax History
| Year | Tax Paid | Tax Assessment Tax Assessment Total Assessment is a certain percentage of the fair market value that is determined by local assessors to be the total taxable value of land and additions on the property. | Land | Improvement |
|---|---|---|---|---|
| 2025 | $213 | $236,225 | $68,750 | $167,475 |
| 2023 | $1,562 | $228,965 | $55,000 | $173,965 |
| 2022 | $1,643 | $226,655 | $52,250 | $174,405 |
| 2021 | $1,578 | $323,400 | $65,000 | $258,400 |
| 2020 | $1,472 | $285,500 | $65,000 | $220,500 |
| 2019 | $1,328 | $251,800 | $60,000 | $191,800 |
| 2018 | $2,358 | $230,200 | $0 | $0 |
| 2017 | $2,063 | $195,900 | $0 | $0 |
| 2016 | $2,187 | $191,800 | $0 | $0 |
| 2015 | $2,137 | $180,400 | $0 | $0 |
| 2014 | $2,025 | $171,800 | $0 | $0 |
Source: Public Records
Map
Nearby Homes
- 163 S 480 E
- 372 E 400 S
- 411 E Majestic Dr
- 426 S Coyote Way
- 823 E Majestic Dr
- 751 E Majestic Dr
- 697 E Coral Autumn Ln
- 422 S 175 E
- 473 S Chula Vista Dr
- 691 Crimson Flare Ln
- 544 S Fiesta Dr
- 673 Coral Autumn Ln
- 567 S Fiesta Dr
- 565 S 250 E
- 375 E 615 S
- 256 E 580 S
- 61 E 490 S
- 334 E 615 S Unit 17
- 676 E Palisades Dr
- 851 E Posado St
Your Personal Tour Guide
Ask me questions while you tour the home.