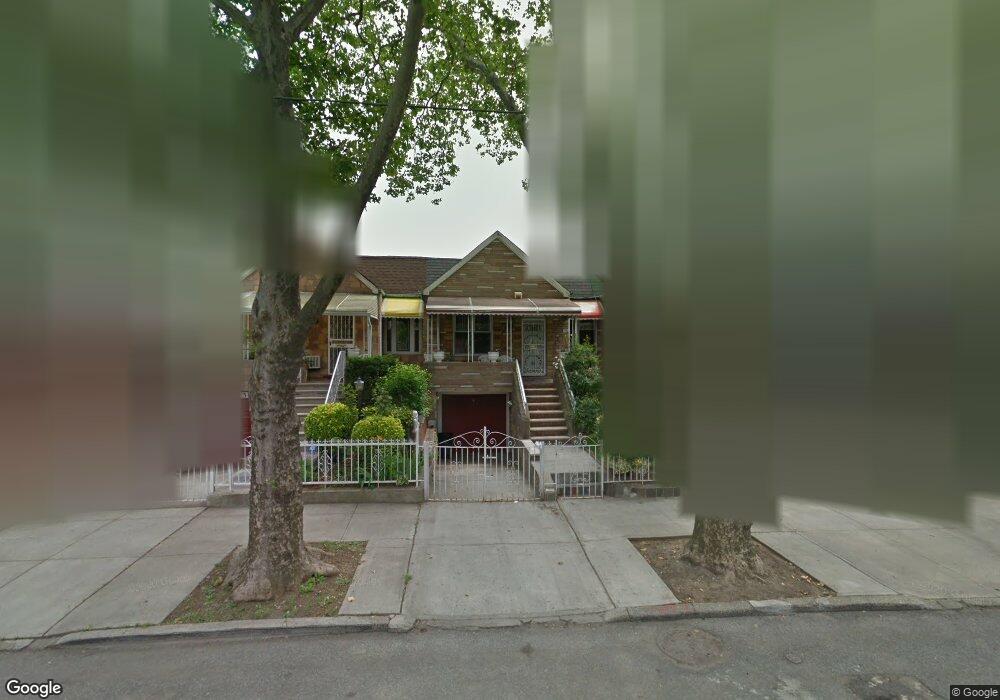
395 E 56th St Brooklyn, NY 11203
East Flatbush NeighborhoodEstimated Value: $627,180 - $782,000
About This Home
This home is located at 395 E 56th St, Brooklyn, NY 11203 and is currently estimated at $707,295, approximately $428 per square foot. 395 E 56th St is a home located in Kings County with nearby schools including Ps 244 Richard R Green, I.S. 285 Meyer Levin, and Ivy Hill Preparatory Charter School.
Ownership History
We collect this data history from publicly available records. To have your information removed, we recommend requesting removal directly through your county’s website.
Purchase Details
Home Financials for this Owner
Home Financials are based on the most recent Mortgage that was taken out on this home.Purchase Details
Home Financials for this Owner
Home Financials are based on the most recent Mortgage that was taken out on this home.Home Values in the Area
Average Home Value in this Area
Purchase History
We collect this data history from publicly available records. To have your information removed, we recommend requesting removal directly through your county’s website.
| Date | Buyer | Sale Price | Title Company |
|---|---|---|---|
| $340,000 | -- | ||
| -- | -- |
Mortgage History
We collect this data history from publicly available records. To have your information removed, we recommend requesting removal directly through your county’s website.
| Date | Status | Borrower | Loan Amount |
|---|---|---|---|
| Open | $272,000 | ||
| Previous Owner | $237,500 |
Tax History
We collect this data history from publicly available records. To have your information removed, we recommend requesting removal directly through your county’s website.
| Year | Tax Paid | Tax Assessment Tax Assessment Total Assessment is a certain percentage of the fair market value that is determined by local assessors to be the total taxable value of land and additions on the property. | Land | Improvement |
|---|---|---|---|---|
| 2026 | $5,478 | $48,660 | $13,200 | $35,460 |
| 2025 | $5,156 | $46,440 | $13,200 | $33,240 |
| 2024 | $5,156 | $36,660 | $13,200 | $23,460 |
| 2023 | $5,214 | $42,540 | $13,200 | $29,340 |
| 2022 | $5,076 | $36,300 | $13,200 | $23,100 |
| 2021 | $5,038 | $32,220 | $13,200 | $19,020 |
| 2020 | $2,353 | $32,160 | $13,200 | $18,960 |
| 2019 | $4,426 | $32,160 | $13,200 | $18,960 |
| 2018 | $4,301 | $22,560 | $9,329 | $13,231 |
| 2017 | $4,264 | $22,387 | $10,218 | $12,169 |
| 2016 | $3,912 | $21,120 | $11,089 | $10,031 |
| 2015 | $2,327 | $19,926 | $10,662 | $9,264 |
| 2014 | $2,327 | $18,800 | $12,071 | $6,729 |
Map
- 399 E 57th St
- 505 E 54th St
- 281 E 57th St Unit 1
- 5306 Beverley Rd
- 5910 Beverley Rd
- 541 E 54th St
- 5823 Tilden Ave
- 514 E 53rd St
- 5401 Clarendon Rd
- 494 E 53rd St
- 5606 Snyder Ave
- 361 E 59th St
- 162 E 59th St
- 540 E 52nd St
- 524 E 56th St
- 596 E 52nd St
- 528 E 56th St
- 5908 Snyder Ave
- 567 E 51st St
- 557 E 51st St
Ask me questions while you tour the home.