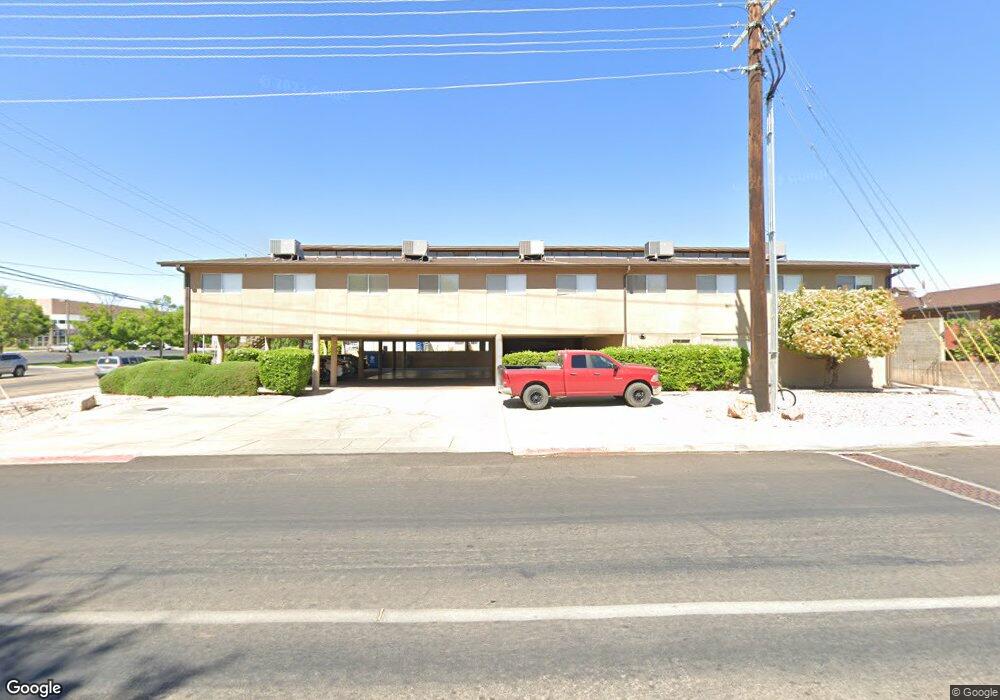
395 E 700 S Unit 6 Saint George, UT 84770
Estimated Value: $149,000 - $307,000
2
Beds
1
Bath
756
Sq Ft
$302/Sq Ft
Est. Value
About This Home
This home is located at 395 E 700 S Unit 6, Saint George, UT 84770 and is currently estimated at $228,000, approximately $301 per square foot. 395 E 700 S Unit 6 is a home located in Washington County with nearby schools including Legacy School, Dixie Middle School, and Tonaquint Intermediate School.
Ownership History
Date
Name
Owned For
Owner Type
Purchase Details
Closed on
Nov 20, 2008
Sold by
Koopmans Shawn L
Bought by
Pride Land Investments Llc
Current Estimated Value
Home Financials for this Owner
Home Financials are based on the most recent Mortgage that was taken out on this home.
Original Mortgage
$20,000
Outstanding Balance
$12,956
Interest Rate
5.9%
Mortgage Type
Purchase Money Mortgage
Estimated Equity
$215,044
Purchase Details
Closed on
Oct 10, 2008
Sold by
Pride Land Investments Llc
Bought by
Koopmans Shawn L
Home Financials for this Owner
Home Financials are based on the most recent Mortgage that was taken out on this home.
Original Mortgage
$20,000
Outstanding Balance
$12,956
Interest Rate
5.9%
Mortgage Type
Purchase Money Mortgage
Estimated Equity
$215,044
Purchase Details
Closed on
Aug 29, 2008
Sold by
Investments F O E R Lc
Bought by
Pride Land Investments Llc
Create a Home Valuation Report for This Property
The Home Valuation Report is an in-depth analysis detailing your home's value as well as a comparison with similar homes in the area
Purchase History
| Date | Buyer | Sale Price | Title Company |
|---|---|---|---|
| Pride Land Investments Llc | -- | United Title Services | |
| Koopmans Shawn L | -- | United Title Services | |
| Pride Land Investments Llc | -- | Southern Utah Title Co |
Source: Public Records
Mortgage History
| Date | Status | Borrower | Loan Amount |
|---|---|---|---|
| Open | Pride Land Investments Llc | $20,000 |
Source: Public Records
Tax History
| Year | Tax Paid | Tax Assessment Tax Assessment Total Assessment is a certain percentage of the fair market value that is determined by local assessors to be the total taxable value of land and additions on the property. | Land | Improvement |
|---|---|---|---|---|
| 2025 | $664 | $98,285 | $26,950 | $71,335 |
| 2023 | $755 | $112,805 | $26,950 | $85,855 |
| 2022 | $757 | $106,315 | $23,100 | $83,215 |
| 2021 | $643 | $134,800 | $28,000 | $106,800 |
| 2020 | $580 | $114,500 | $28,000 | $86,500 |
| 2019 | $536 | $103,400 | $28,000 | $75,400 |
| 2018 | $538 | $51,975 | $0 | $0 |
| 2017 | $410 | $39,600 | $0 | $0 |
| 2016 | $410 | $36,685 | $0 | $0 |
| 2015 | $419 | $35,915 | $0 | $0 |
| 2014 | $389 | $33,550 | $0 | $0 |
Source: Public Records
Map
Nearby Homes
- 464 E 700 S
- 777 S 400 E Unit 67
- 777 S 400 E Unit 45
- 251 E 700 S
- 524 S 200 E Unit 3
- 840 S 400 E Unit 58
- 543 S 600 E
- 635 Concord Way
- 376 E 300 S Unit 2
- 433 S 100 E
- 55 E 700 S Unit 8
- 701 E 900 S Unit 33
- 454 S 100 E Unit 10
- 670 E 900 S
- 295 S 200 E
- 608 E 1010 S
- 255 S 200 E Unit 13
- 105 E 300 S
- 79 W 500 S
- 375 S Main St Unit 4
- 395 E 700 S Unit 9
- 395 E 700 S Unit 8
- 395 E 700 S Unit 7
- 395 E 700 S Unit 5
- 395 E 700 S Unit 4
- 395 E 700 S Unit 3
- 395 E 700 S Unit 2
- 395 E 700 S Unit 10
- 395 E 700 S Unit 1
- 660 S 400 E Unit 4
- 660 S 400 E Unit 3
- 660 S 400 E Unit 2
- 660 S 400 E Unit 1
- 660 S 400 E Unit 5
- 660 S 400 E Unit 6
- 660 S 400 E Unit 8
- 660 S 400 E Unit 12
- 660 S 400 E Unit 10
- 660 S 400 E Unit 9
- 660 S 400 E Unit 13