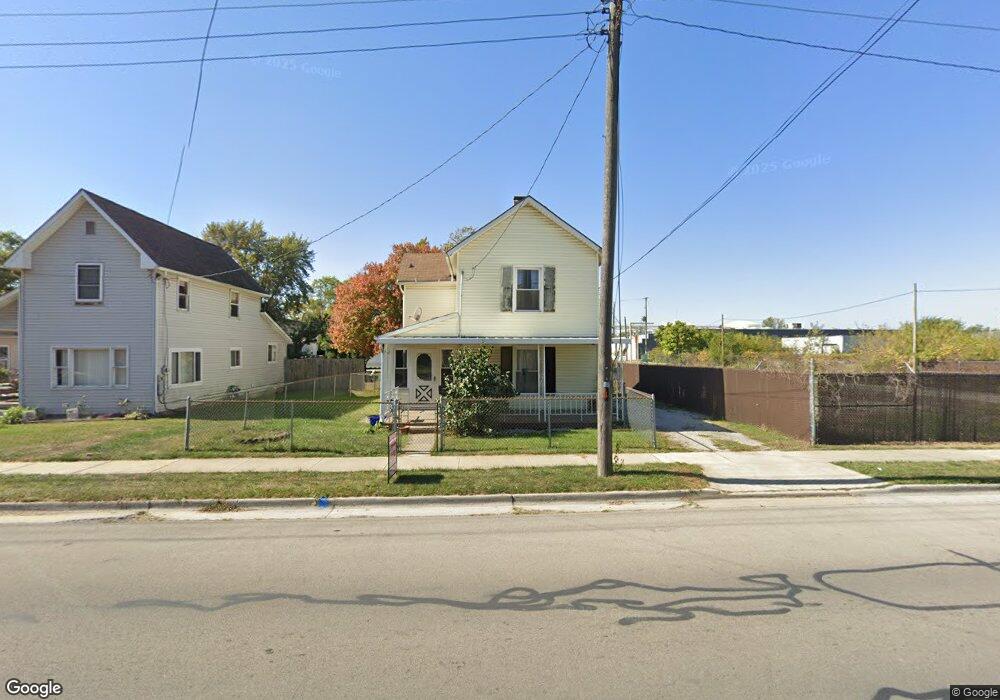
395 Leader St Marion, OH 43302
Estimated Value: $97,000 - $101,000
3
Beds
1
Bath
1,296
Sq Ft
$76/Sq Ft
Est. Value
About This Home
This home is located at 395 Leader St, Marion, OH 43302 and is currently estimated at $99,000, approximately $76 per square foot. 395 Leader St is a home located in Marion County with nearby schools including Rutherford B. Hayes Elementary School, Ulysses S. Grant Middle School, and Harding High School.
Ownership History
Date
Name
Owned For
Owner Type
Purchase Details
Closed on
Dec 18, 2023
Sold by
Berry William and Berry Tammy
Bought by
Hartzell Charles and Hartzell Pamela
Current Estimated Value
Purchase Details
Closed on
Dec 3, 2020
Sold by
Swartz Mary Jo and Swartz Norman
Bought by
Berry William
Purchase Details
Closed on
Mar 4, 2019
Sold by
Estate Of Larry E Berry
Bought by
Berry William and Berry Jerry
Create a Home Valuation Report for This Property
The Home Valuation Report is an in-depth analysis detailing your home's value as well as a comparison with similar homes in the area
Home Values in the Area
Average Home Value in this Area
Purchase History
| Date | Buyer | Sale Price | Title Company |
|---|---|---|---|
| Hartzell Charles | $26,800 | None Listed On Document | |
| Hartzell Charles | $26,800 | None Listed On Document | |
| Hartzell Charles | $26,800 | None Listed On Document | |
| Berry William | $11,000 | None Available | |
| Berry William | -- | None Available |
Source: Public Records
Tax History Compared to Growth
Tax History
| Year | Tax Paid | Tax Assessment Tax Assessment Total Assessment is a certain percentage of the fair market value that is determined by local assessors to be the total taxable value of land and additions on the property. | Land | Improvement |
|---|---|---|---|---|
| 2024 | $862 | $22,460 | $1,690 | $20,770 |
| 2023 | $862 | $22,460 | $1,690 | $20,770 |
| 2022 | $801 | $22,460 | $1,690 | $20,770 |
| 2021 | $693 | $17,490 | $1,470 | $16,020 |
| 2020 | $694 | $17,490 | $1,470 | $16,020 |
| 2019 | $694 | $17,490 | $1,470 | $16,020 |
| 2018 | $654 | $16,470 | $1,460 | $15,010 |
| 2017 | $303 | $16,470 | $1,460 | $15,010 |
| 2016 | $300 | $16,470 | $1,460 | $15,010 |
| 2015 | $292 | $16,100 | $1,390 | $14,710 |
| 2014 | $294 | $16,100 | $1,390 | $14,710 |
| 2012 | $394 | $18,600 | $1,470 | $17,130 |
Source: Public Records
Map
Nearby Homes
- 343 Commercial St
- 347 Mary St
- 468 Avondale Ave
- 551 Universal Ave Unit 555
- 236 Silver St
- 473 Avondale Ave
- 178 Leader St
- 678 Marshall St
- 531 Toledo Ave
- 641 Blake Ave
- 395 N Main St
- 375 N Main St
- 552 N Prospect St
- 434 Scranton Ave
- 565 Milburn Ave
- 325 Holmes Place
- 434 N State St
- 593 N State St
- 523 Thompson St
- 198 Windsor St