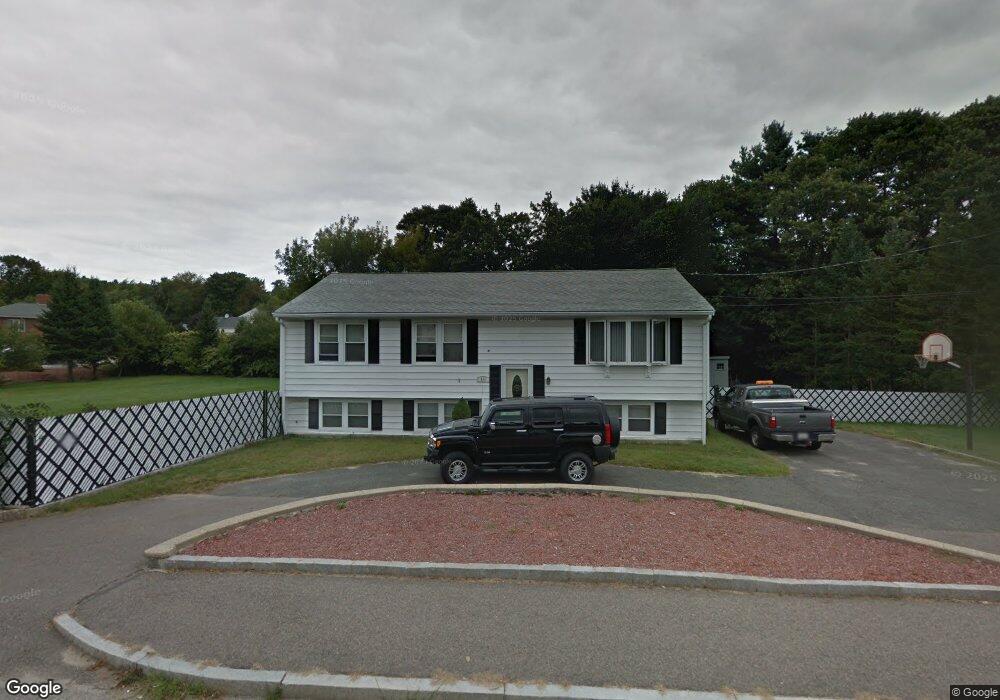
395 Main St Saugus, MA 01906
Oakland Vale NeighborhoodEstimated Value: $754,000 - $996,000
3
Beds
2
Baths
1,288
Sq Ft
$660/Sq Ft
Est. Value
About This Home
This home is located at 395 Main St, Saugus, MA 01906 and is currently estimated at $850,312, approximately $660 per square foot. 395 Main St is a home located in Essex County with nearby schools including Saugus High School, Pioneer Charter School Of Science II, and Melrose Montessori School.
Ownership History
Date
Name
Owned For
Owner Type
Purchase Details
Closed on
Feb 16, 2021
Sold by
Giangregorio Anthony and Giangregorio Lynnette A
Bought by
Giangregorio Anthony and Giangregorio Nicholas
Current Estimated Value
Home Financials for this Owner
Home Financials are based on the most recent Mortgage that was taken out on this home.
Original Mortgage
$447,700
Outstanding Balance
$398,587
Interest Rate
2.7%
Mortgage Type
FHA
Estimated Equity
$451,725
Purchase Details
Closed on
Jan 27, 1997
Sold by
Conrad Albert H
Bought by
Giangregorio Anthony and Giangregorio Lynnette
Create a Home Valuation Report for This Property
The Home Valuation Report is an in-depth analysis detailing your home's value as well as a comparison with similar homes in the area
Home Values in the Area
Average Home Value in this Area
Purchase History
| Date | Buyer | Sale Price | Title Company |
|---|---|---|---|
| Giangregorio Anthony | -- | None Available | |
| Giangregorio Anthony | $174,000 | -- |
Source: Public Records
Mortgage History
| Date | Status | Borrower | Loan Amount |
|---|---|---|---|
| Open | Giangregorio Anthony | $447,700 | |
| Previous Owner | Giangregorio Anthony | $250,000 | |
| Previous Owner | Giangregorio Anthony | $53,700 | |
| Previous Owner | Giangregorio Anthony | $225,000 |
Source: Public Records
Tax History
| Year | Tax Paid | Tax Assessment Tax Assessment Total Assessment is a certain percentage of the fair market value that is determined by local assessors to be the total taxable value of land and additions on the property. | Land | Improvement |
|---|---|---|---|---|
| 2025 | $6,680 | $625,500 | $332,000 | $293,500 |
| 2024 | $6,286 | $590,200 | $301,900 | $288,300 |
| 2023 | $6,168 | $547,800 | $271,900 | $275,900 |
| 2022 | $6,159 | $512,800 | $248,700 | $264,100 |
| 2021 | $5,933 | $480,800 | $216,700 | $264,100 |
| 2020 | $5,568 | $467,100 | $206,700 | $260,400 |
| 2019 | $5,286 | $434,000 | $186,700 | $247,300 |
| 2018 | $4,860 | $419,700 | $181,700 | $238,000 |
| 2017 | $4,578 | $379,900 | $169,700 | $210,200 |
| 2016 | $4,595 | $376,600 | $161,300 | $215,300 |
| 2015 | $4,312 | $358,700 | $153,700 | $205,000 |
| 2014 | $3,903 | $336,200 | $153,700 | $182,500 |
Source: Public Records
Map
Nearby Homes
- 21 Athens Dr
- 86 Lynn Fells Pkwy
- 1215 Sheffield Way
- 148 Forest St
- 93 Sweetwater St
- 348 Lynn Fells Pkwy
- 34 Golden Hills Rd
- 225 Howard St
- 176 Bay State Rd
- 9 Ledge St
- 7 West St
- 846 Broadway Unit 40
- 905 Sherwood Forest Ln
- 9 Elmcrest Cir
- 89 Lovell Rd
- 515 Upham St
- 7 Nirvana Dr
- 70 Old Nahant Rd
- 29 Susan Dr
- 128 Green St Unit 128