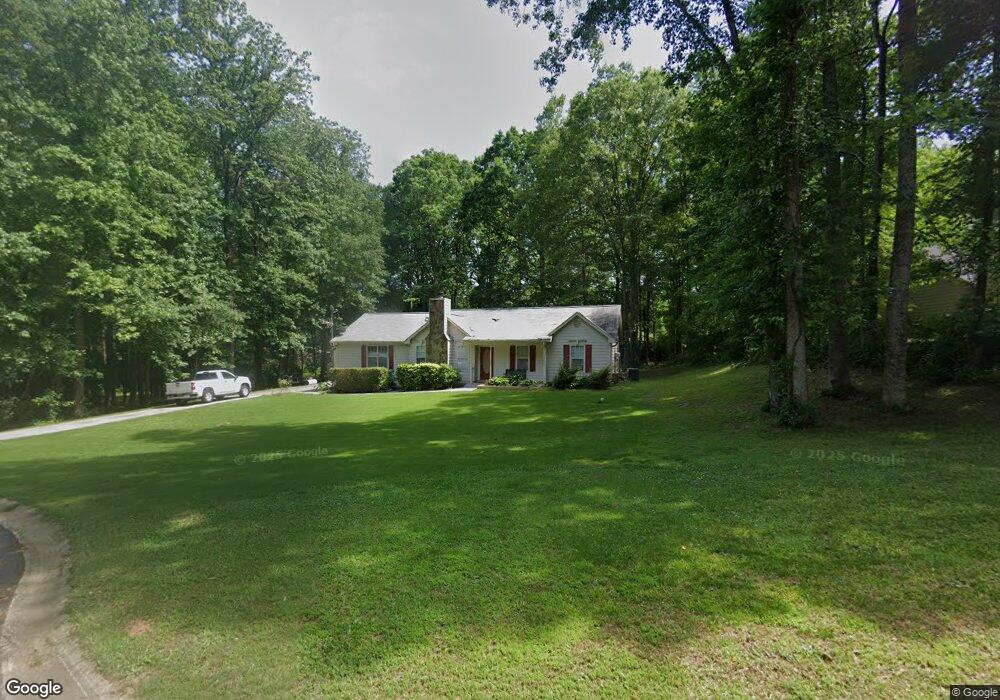
395 Marsha Way Sharpsburg, GA 30277
Estimated Value: $290,135 - $320,000
3
Beds
2
Baths
1,378
Sq Ft
$224/Sq Ft
Est. Value
About This Home
This home is located at 395 Marsha Way, Sharpsburg, GA 30277 and is currently estimated at $309,034, approximately $224 per square foot. 395 Marsha Way is a home located in Coweta County with nearby schools including Poplar Road Elementary School, East Coweta Middle School, and East Coweta High School.
Ownership History
Date
Name
Owned For
Owner Type
Purchase Details
Closed on
Jul 18, 2005
Sold by
Sauerzopf Lois E
Bought by
Saengerhausen Charlie R
Current Estimated Value
Home Financials for this Owner
Home Financials are based on the most recent Mortgage that was taken out on this home.
Original Mortgage
$130,150
Outstanding Balance
$66,629
Interest Rate
5.46%
Mortgage Type
New Conventional
Estimated Equity
$242,405
Purchase Details
Closed on
Oct 27, 1997
Sold by
Copelan Jay C and Copelan Beverly D
Bought by
Sauerzopf Lois E
Home Financials for this Owner
Home Financials are based on the most recent Mortgage that was taken out on this home.
Original Mortgage
$90,900
Interest Rate
7.55%
Mortgage Type
New Conventional
Purchase Details
Closed on
Dec 2, 1994
Sold by
Lindsey Homes
Bought by
Copelan Jay Beverly
Home Financials for this Owner
Home Financials are based on the most recent Mortgage that was taken out on this home.
Original Mortgage
$86,963
Interest Rate
9.01%
Mortgage Type
FHA
Purchase Details
Closed on
Nov 9, 1994
Bought by
David Lindsey Homes
Home Financials for this Owner
Home Financials are based on the most recent Mortgage that was taken out on this home.
Original Mortgage
$86,963
Interest Rate
9.01%
Mortgage Type
FHA
Purchase Details
Closed on
May 27, 1993
Bought by
Reese Builders & Dev
Create a Home Valuation Report for This Property
The Home Valuation Report is an in-depth analysis detailing your home's value as well as a comparison with similar homes in the area
Home Values in the Area
Average Home Value in this Area
Purchase History
| Date | Buyer | Sale Price | Title Company |
|---|---|---|---|
| Saengerhausen Charlie R | $137,000 | -- | |
| Sauerzopf Lois E | $93,800 | -- | |
| Copelan Jay Beverly | $89,000 | -- | |
| David Lindsey Homes | $29,500 | -- | |
| Reese Builders & Dev | $480,100 | -- |
Source: Public Records
Mortgage History
| Date | Status | Borrower | Loan Amount |
|---|---|---|---|
| Open | Saengerhausen Charlie R | $130,150 | |
| Previous Owner | Sauerzopf Lois E | $90,900 | |
| Previous Owner | Copelan Jay Beverly | $86,963 |
Source: Public Records
Tax History Compared to Growth
Tax History
| Year | Tax Paid | Tax Assessment Tax Assessment Total Assessment is a certain percentage of the fair market value that is determined by local assessors to be the total taxable value of land and additions on the property. | Land | Improvement |
|---|---|---|---|---|
| 2025 | $1,392 | $102,786 | $26,000 | $76,786 |
| 2024 | $2,136 | $96,605 | $26,000 | $70,605 |
| 2023 | $2,136 | $101,841 | $24,000 | $77,841 |
| 2022 | $1,920 | $82,638 | $20,000 | $62,638 |
| 2021 | $1,689 | $68,827 | $16,000 | $52,827 |
| 2020 | $1,699 | $68,827 | $16,000 | $52,827 |
| 2019 | $1,787 | $65,850 | $10,000 | $55,850 |
| 2018 | $1,791 | $65,850 | $10,000 | $55,850 |
| 2017 | $1,636 | $60,607 | $10,000 | $50,607 |
| 2016 | $1,619 | $60,607 | $10,000 | $50,607 |
| 2015 | $1,445 | $55,364 | $10,000 | $45,364 |
| 2014 | $1,288 | $50,121 | $10,000 | $40,121 |
Source: Public Records
Map
Nearby Homes
- 138 Main St
- 140 Halo Trace
- 1 Mcintosh Trail
- 46 Lullwater Ct
- 565 Timberbrook Dr
- 0 Bob Smith Rd Unit 10562838
- 68 Winchester Dr
- 196 Bob Smith Rd
- 250 Bob Smith Rd
- 180 Saint James Place
- 49 Durham Estates Dr
- 0 Highway 154 Unit 10470800
- 296 Mcintosh Trail
- 25 Chemin Place
- 25 Lentry Dr
- 65 Oakhurst Trail
- 69 Oakhurst Trail
- 165 Durham Estates Dr
- 28 Fawn Ct
- 316 Winchester Dr
- 373 Marsha Way
- 160 Angel Trace
- 8 Jeanette Ct
- 367 Marsha Way
- 384 Marsha Way
- 134 Angel Trace
- 372 Marsha Way
- 10 Jeanette Ct
- 357 Marsha Way
- 126 Angel Trace
- 133 Angel Trace
- 28 Jeanette Ct Unit 88
- 28 Jeanette Ct
- 3991 Highway 16 E
- 59 Wellsburg Ct
- 55 Wellsburg Ct
- 116 Angel Trace
- 19 Jeanette Ct
- 44 Jeanette Ct
- 353 Marsha Way Unit 38