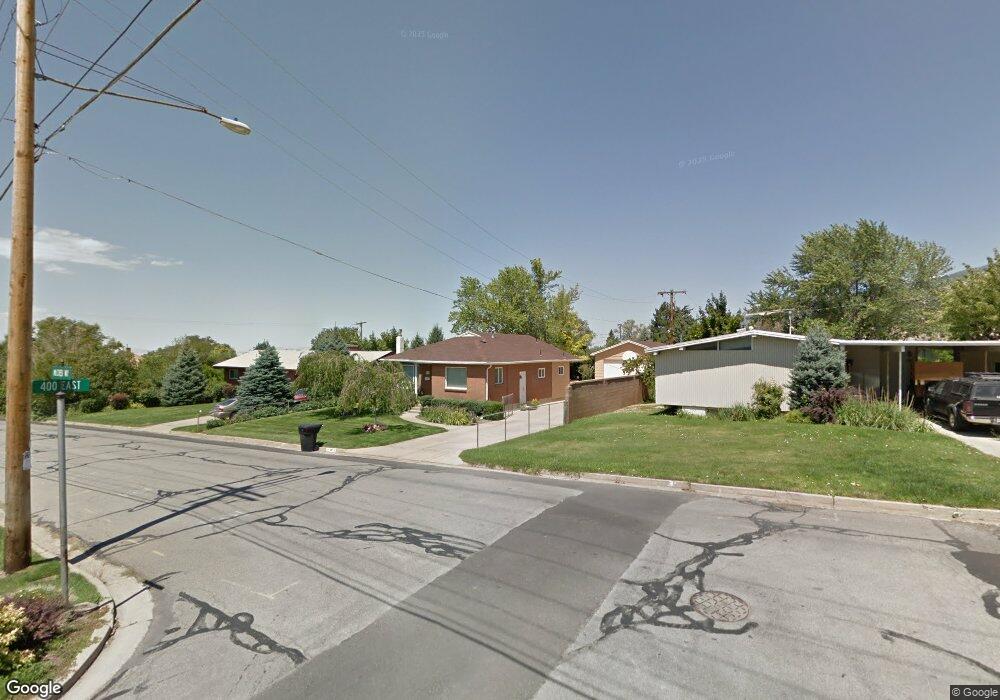
395 Millcreek Way Bountiful, UT 84010
Estimated Value: $527,000 - $576,000
4
Beds
3
Baths
1,240
Sq Ft
$441/Sq Ft
Est. Value
About This Home
This home is located at 395 Millcreek Way, Bountiful, UT 84010 and is currently estimated at $546,950, approximately $441 per square foot. 395 Millcreek Way is a home located in Davis County with nearby schools including Valley View School, Millcreek Junior High School, and Bountiful High School.
Ownership History
Date
Name
Owned For
Owner Type
Purchase Details
Closed on
Apr 21, 2021
Sold by
Drollinger Brent Lee and Drollinger Cynthia Dawn
Bought by
Drollinger Brent Lee and Drollinger Cynthia Dawn
Current Estimated Value
Home Financials for this Owner
Home Financials are based on the most recent Mortgage that was taken out on this home.
Original Mortgage
$194,000
Interest Rate
3.05%
Mortgage Type
New Conventional
Purchase Details
Closed on
Jul 11, 2003
Sold by
Tolman Ray B and Tolman Janice E
Bought by
Drollinger Brent L and Drollinger Cynthia D
Home Financials for this Owner
Home Financials are based on the most recent Mortgage that was taken out on this home.
Original Mortgage
$148,000
Interest Rate
5.18%
Mortgage Type
Purchase Money Mortgage
Purchase Details
Closed on
Jun 27, 2000
Sold by
Tolman Ray B and Tolman Janice E
Bought by
Tolman Ray B and Tolman Janice E
Create a Home Valuation Report for This Property
The Home Valuation Report is an in-depth analysis detailing your home's value as well as a comparison with similar homes in the area
Home Values in the Area
Average Home Value in this Area
Purchase History
| Date | Buyer | Sale Price | Title Company |
|---|---|---|---|
| Drollinger Brent Lee | -- | Accommodation | |
| Drollinger Brent Lee | -- | North American Title | |
| Drollinger Brent Lee | -- | North American Title | |
| Drollinger Brent L | -- | First American Title Co | |
| Tolman Ray B | -- | -- |
Source: Public Records
Mortgage History
| Date | Status | Borrower | Loan Amount |
|---|---|---|---|
| Previous Owner | Drollinger Brent Lee | $194,000 | |
| Previous Owner | Drollinger Brent L | $148,000 |
Source: Public Records
Tax History Compared to Growth
Tax History
| Year | Tax Paid | Tax Assessment Tax Assessment Total Assessment is a certain percentage of the fair market value that is determined by local assessors to be the total taxable value of land and additions on the property. | Land | Improvement |
|---|---|---|---|---|
| 2025 | $3,121 | $272,250 | $161,796 | $110,454 |
| 2024 | $2,903 | $262,900 | $154,572 | $108,328 |
| 2023 | $2,788 | $459,000 | $274,930 | $184,070 |
| 2022 | $2,957 | $268,400 | $147,649 | $120,751 |
| 2021 | $2,574 | $357,000 | $193,623 | $163,377 |
| 2020 | $2,290 | $317,000 | $161,954 | $155,046 |
| 2019 | $2,319 | $314,000 | $149,368 | $164,632 |
| 2018 | $2,182 | $290,000 | $145,955 | $144,045 |
| 2016 | $1,829 | $131,065 | $77,468 | $53,597 |
| 2015 | $1,812 | $122,595 | $77,468 | $45,127 |
| 2014 | $1,823 | $127,690 | $77,468 | $50,222 |
| 2013 | -- | $119,369 | $56,534 | $62,835 |
Source: Public Records
Map
Nearby Homes
- 305 E Peach Ln S Unit G
- 534 E 1400 S
- 288 E Peach Ln S
- 520 S Orchard Dr Unit 17
- 573 E 1600 S
- 861 E Millbrook Way
- 545 S 100 E
- 285 E 1650 S
- 1653 S 500 E
- 99 E 1600 S
- 141 E 1650 S
- 490 E 1800 S
- 530 E 1800 S Unit 51
- 650 S Main St Unit 6111
- 650 S Main St Unit 1301
- 90 W 1300 S
- 1761 S Davis Blvd
- 630 E 1800 S
- 718 E 200 S
- 1871 S 350 E
- 375 Millcreek Way
- 425 Millcreek Way
- 990 Horsley Cir
- 445 Millcreek Way
- 1015 Orchard Dr
- 917 Orchard Dr
- 995 Orchard Dr
- 985 Horsley Cir
- 995 S Orchard Dr
- 380 Millcreek Way
- 915 S Orchard Dr
- 360 Millcreek Way
- 440 Millcreek Way
- 467 Millcreek Way
- 995 Horsley Cir
- 1005 Horsley Cir
- 1085 Orchard Dr
- 935 Orchard Dr
- 1106 S 400 E
- 480 Millcreek Way