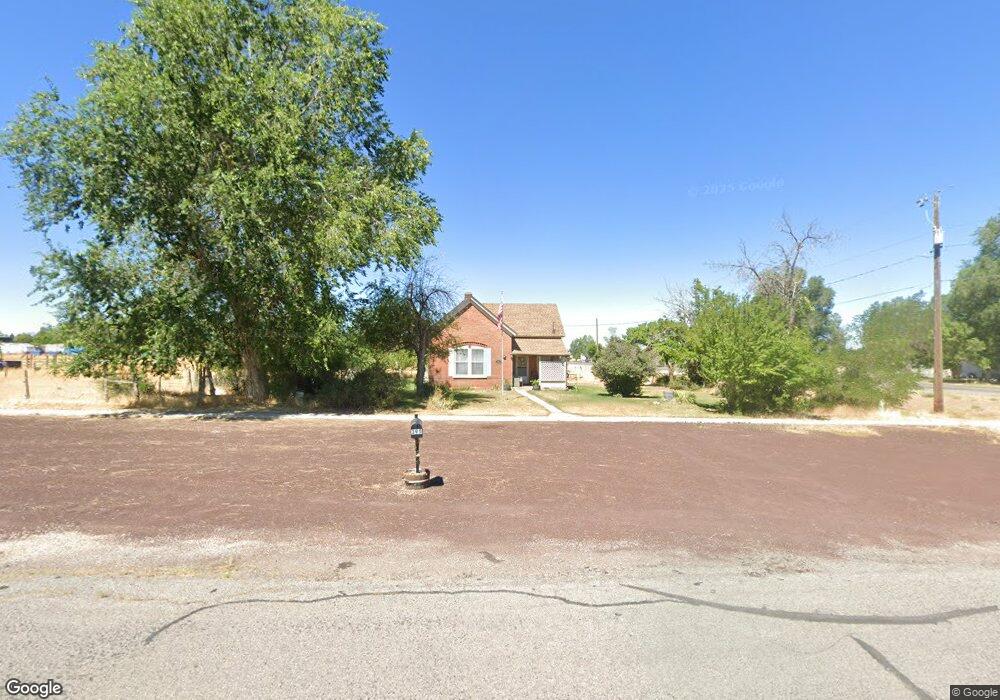
395 N 100 W Fillmore, UT 84631
Estimated Value: $191,727 - $251,000
2
Beds
1
Bath
828
Sq Ft
$265/Sq Ft
Est. Value
About This Home
This home is located at 395 N 100 W, Fillmore, UT 84631 and is currently estimated at $219,682, approximately $265 per square foot. 395 N 100 W is a home located in Millard County.
Ownership History
Date
Name
Owned For
Owner Type
Purchase Details
Closed on
Jul 28, 2016
Sold by
Beckstead Vance
Bought by
Bland Edith
Current Estimated Value
Home Financials for this Owner
Home Financials are based on the most recent Mortgage that was taken out on this home.
Original Mortgage
$90,488
Outstanding Balance
$71,948
Interest Rate
3.54%
Mortgage Type
New Conventional
Estimated Equity
$147,734
Purchase Details
Closed on
Dec 5, 2006
Sold by
Nielsen Steve
Bought by
Beckstead Vabce
Home Financials for this Owner
Home Financials are based on the most recent Mortgage that was taken out on this home.
Original Mortgage
$47,500
Interest Rate
6.32%
Purchase Details
Closed on
Nov 30, 2006
Sold by
Tc Properties Llc
Bought by
Nielsen Steve
Home Financials for this Owner
Home Financials are based on the most recent Mortgage that was taken out on this home.
Original Mortgage
$47,500
Interest Rate
6.32%
Create a Home Valuation Report for This Property
The Home Valuation Report is an in-depth analysis detailing your home's value as well as a comparison with similar homes in the area
Home Values in the Area
Average Home Value in this Area
Purchase History
| Date | Buyer | Sale Price | Title Company |
|---|---|---|---|
| Bland Edith | -- | First American Title | |
| Beckstead Vabce | -- | -- | |
| Nielsen Steve | -- | -- |
Source: Public Records
Mortgage History
| Date | Status | Borrower | Loan Amount |
|---|---|---|---|
| Open | Bland Edith | $90,488 | |
| Previous Owner | Beckstead Vabce | $47,500 | |
| Previous Owner | Nielsen Steve | $47,500 |
Source: Public Records
Tax History Compared to Growth
Tax History
| Year | Tax Paid | Tax Assessment Tax Assessment Total Assessment is a certain percentage of the fair market value that is determined by local assessors to be the total taxable value of land and additions on the property. | Land | Improvement |
|---|---|---|---|---|
| 2025 | $961 | $120,676 | $33,086 | $87,590 |
| 2024 | $961 | $90,915 | $25,596 | $65,319 |
| 2023 | $1,011 | $90,915 | $25,596 | $65,319 |
| 2022 | $806 | $72,404 | $23,269 | $49,135 |
| 2021 | $677 | $58,395 | $15,110 | $43,285 |
| 2020 | $625 | $54,214 | $13,736 | $40,478 |
| 2019 | $545 | $47,443 | $13,736 | $33,707 |
| 2018 | $522 | $46,492 | $13,736 | $32,756 |
| 2017 | $492 | $41,661 | $13,736 | $27,925 |
| 2016 | $334 | $29,557 | $13,736 | $15,821 |
| 2015 | $461 | $40,796 | $24,975 | $15,821 |
| 2014 | -- | $40,796 | $24,975 | $15,821 |
| 2013 | -- | $40,796 | $24,975 | $15,821 |
Source: Public Records
Map
Nearby Homes
- 390 N 100 W
- 380 N 200 St W
- 295 N 100 West St
- 335 W 400 North St
- 165 N 100 W
- 225 W 200 St N
- 75 N 100 West St
- 40 S 100 Rd E
- 410 W 400 N
- 120 S 100 East Rd
- 220 S 200 E
- 190 W 400 St S
- 310 S 500 West Rd
- 2155 N Cedar Mountain Rd
- 2835 N Cedar Mountain Rd
- 430 E Canyon Rd
- 155 E 500 St S
- 157 E 500 South St
- 310 S 600 E
- 600 E 1200 St N