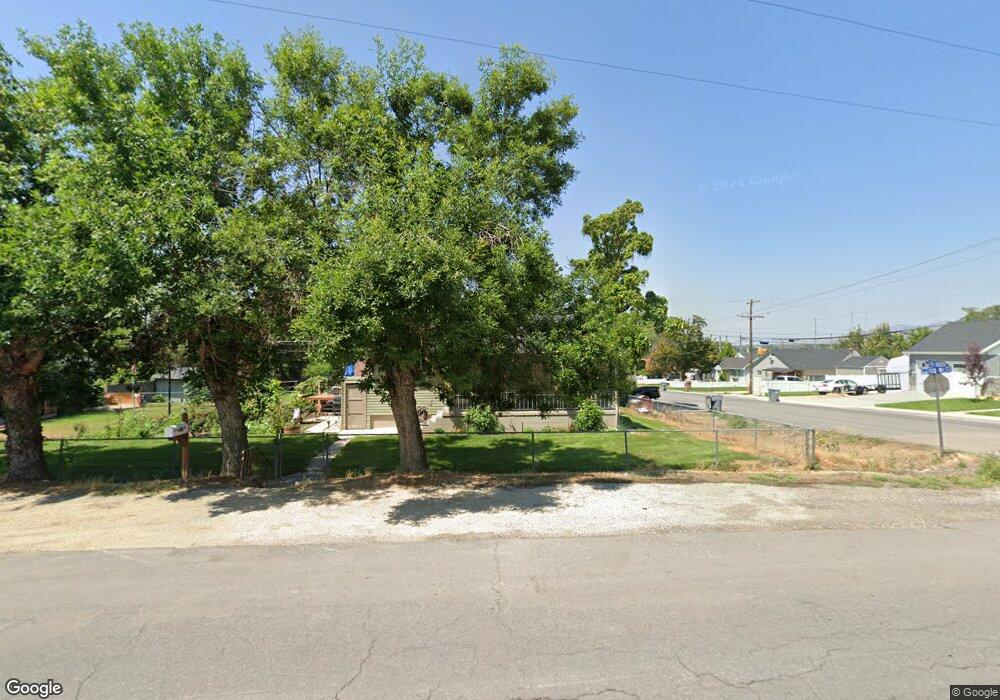
395 N 100 W Pleasant Grove, UT 84062
Estimated Value: $418,000 - $434,196
3
Beds
1
Bath
1,116
Sq Ft
$384/Sq Ft
Est. Value
About This Home
This home is located at 395 N 100 W, Pleasant Grove, UT 84062 and is currently estimated at $429,049, approximately $384 per square foot. 395 N 100 W is a home located in Utah County with nearby schools including Central Elementary School, Pleasant Grove Junior High School, and Pleasant Grove High School.
Ownership History
Date
Name
Owned For
Owner Type
Purchase Details
Closed on
Aug 18, 2017
Sold by
Walker Jimmy Lee
Bought by
Walker Cynthia D
Current Estimated Value
Purchase Details
Closed on
Aug 8, 2017
Sold by
Walker Cynthia D
Bought by
Walker Cynthia D and Cynthia D Walker Living Trust
Purchase Details
Closed on
Dec 13, 2002
Sold by
Walker Cynthia D and Dartez Cynthia Marie
Bought by
Walker Cynthia D
Home Financials for this Owner
Home Financials are based on the most recent Mortgage that was taken out on this home.
Original Mortgage
$124,450
Interest Rate
6.03%
Create a Home Valuation Report for This Property
The Home Valuation Report is an in-depth analysis detailing your home's value as well as a comparison with similar homes in the area
Home Values in the Area
Average Home Value in this Area
Purchase History
| Date | Buyer | Sale Price | Title Company |
|---|---|---|---|
| Walker Cynthia D | -- | None Available | |
| Walker Cynthia D | -- | None Available | |
| Walker Cynthia D | -- | Backman Stewart Title Servi |
Source: Public Records
Mortgage History
| Date | Status | Borrower | Loan Amount |
|---|---|---|---|
| Closed | Walker Cynthia D | $124,450 |
Source: Public Records
Tax History Compared to Growth
Tax History
| Year | Tax Paid | Tax Assessment Tax Assessment Total Assessment is a certain percentage of the fair market value that is determined by local assessors to be the total taxable value of land and additions on the property. | Land | Improvement |
|---|---|---|---|---|
| 2025 | $1,728 | $230,505 | $214,700 | $204,400 |
| 2024 | $1,728 | $206,140 | $0 | $0 |
| 2023 | $1,669 | $203,885 | $0 | $0 |
| 2022 | $1,800 | $218,845 | $0 | $0 |
| 2021 | $1,551 | $287,100 | $154,100 | $133,000 |
| 2020 | $1,425 | $258,500 | $137,600 | $120,900 |
| 2019 | $1,234 | $231,500 | $126,400 | $105,100 |
| 2018 | $1,192 | $211,500 | $115,200 | $96,300 |
| 2017 | $1,092 | $103,125 | $0 | $0 |
| 2016 | $1,102 | $100,485 | $0 | $0 |
| 2015 | $1,079 | $93,225 | $0 | $0 |
| 2014 | $1,076 | $92,015 | $0 | $0 |
Source: Public Records
Map
Nearby Homes