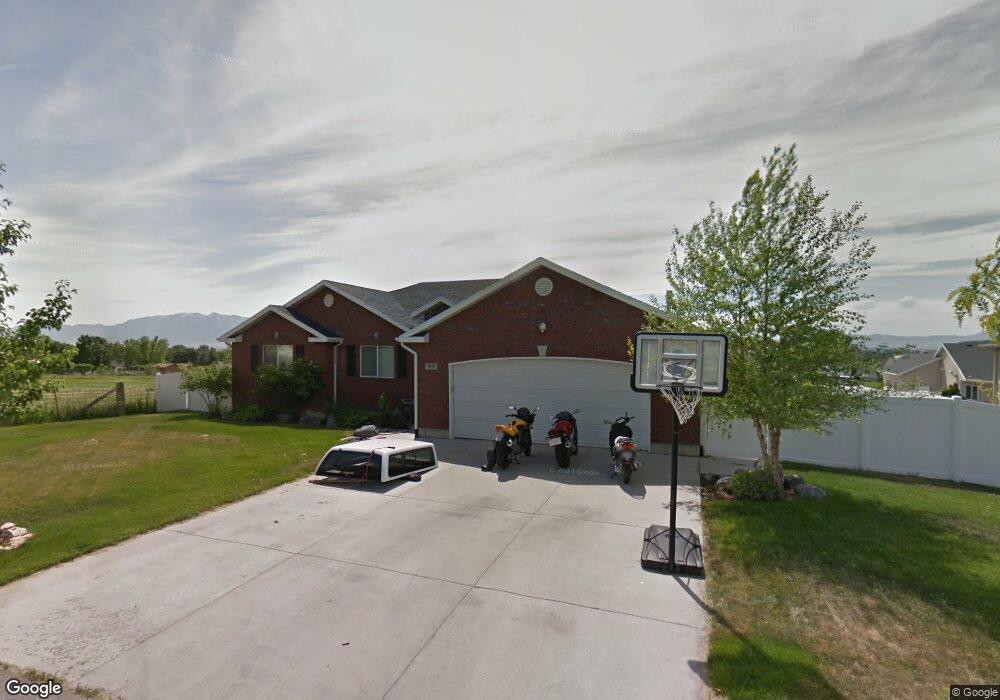
395 N 200 E Hyde Park, UT 84318
Estimated Value: $575,000 - $669,000
6
Beds
3
Baths
3,181
Sq Ft
$194/Sq Ft
Est. Value
About This Home
This home is located at 395 N 200 E, Hyde Park, UT 84318 and is currently estimated at $617,950, approximately $194 per square foot. 395 N 200 E is a home located in Cache County with nearby schools including Summit School, Cedar Ridge School, and North Cache Middle School.
Ownership History
Date
Name
Owned For
Owner Type
Purchase Details
Closed on
Apr 20, 2017
Sold by
Barnett Jason B
Bought by
Shumway Christopher J and Shumway Emily Jane
Current Estimated Value
Home Financials for this Owner
Home Financials are based on the most recent Mortgage that was taken out on this home.
Original Mortgage
$280,489
Outstanding Balance
$232,558
Interest Rate
4.25%
Mortgage Type
FHA
Estimated Equity
$385,392
Purchase Details
Closed on
Jul 11, 2005
Sold by
Smith Nicholas Paul
Bought by
Barnett Jason B
Home Financials for this Owner
Home Financials are based on the most recent Mortgage that was taken out on this home.
Original Mortgage
$187,150
Interest Rate
3.25%
Mortgage Type
Negative Amortization
Create a Home Valuation Report for This Property
The Home Valuation Report is an in-depth analysis detailing your home's value as well as a comparison with similar homes in the area
Home Values in the Area
Average Home Value in this Area
Purchase History
| Date | Buyer | Sale Price | Title Company |
|---|---|---|---|
| Shumway Christopher J | -- | Pinnacle Title | |
| Barnett Jason B | -- | Pinnacle Title |
Source: Public Records
Mortgage History
| Date | Status | Borrower | Loan Amount |
|---|---|---|---|
| Open | Shumway Christopher J | $280,489 | |
| Previous Owner | Barnett Jason B | $187,150 |
Source: Public Records
Tax History
| Year | Tax Paid | Tax Assessment Tax Assessment Total Assessment is a certain percentage of the fair market value that is determined by local assessors to be the total taxable value of land and additions on the property. | Land | Improvement |
|---|---|---|---|---|
| 2025 | $2,297 | $316,735 | $0 | $0 |
| 2024 | $2,313 | $294,105 | $0 | $0 |
| 2023 | $2,414 | $291,910 | $0 | $0 |
| 2022 | $2,510 | $291,905 | $0 | $0 |
| 2021 | $2,401 | $438,475 | $69,400 | $369,075 |
| 2020 | $2,105 | $365,663 | $69,400 | $296,263 |
| 2019 | $2,218 | $365,663 | $69,400 | $296,263 |
| 2018 | $1,975 | $319,270 | $61,650 | $257,620 |
| 2013 | -- | $133,915 | $0 | $0 |
Source: Public Records
Map
Nearby Homes
- 1137 E 200 N Unit 43
- 1138 E 200 N Unit 37
- 1124 E 200 N Unit 38
- 375 N 400 E
- 291 N Main St
- 895 E 100 N Unit 11
- 275 W 260 N
- 10 N 500 E
- 458 W Madison St S
- 1130 E 245 N
- 201 N 1000 E Unit 19
- 1109 E 245 N
- 830 E 410 N Unit 161
- 454 W Madison St S
- 1070 E 200 N Unit 24
- 480 N 729 E
- 640 S 175 E
- 150 E 650 S Unit 108
- 835 E 410 N Unit 156
- 635 S 125 E Unit 120
Your Personal Tour Guide
Ask me questions while you tour the home.