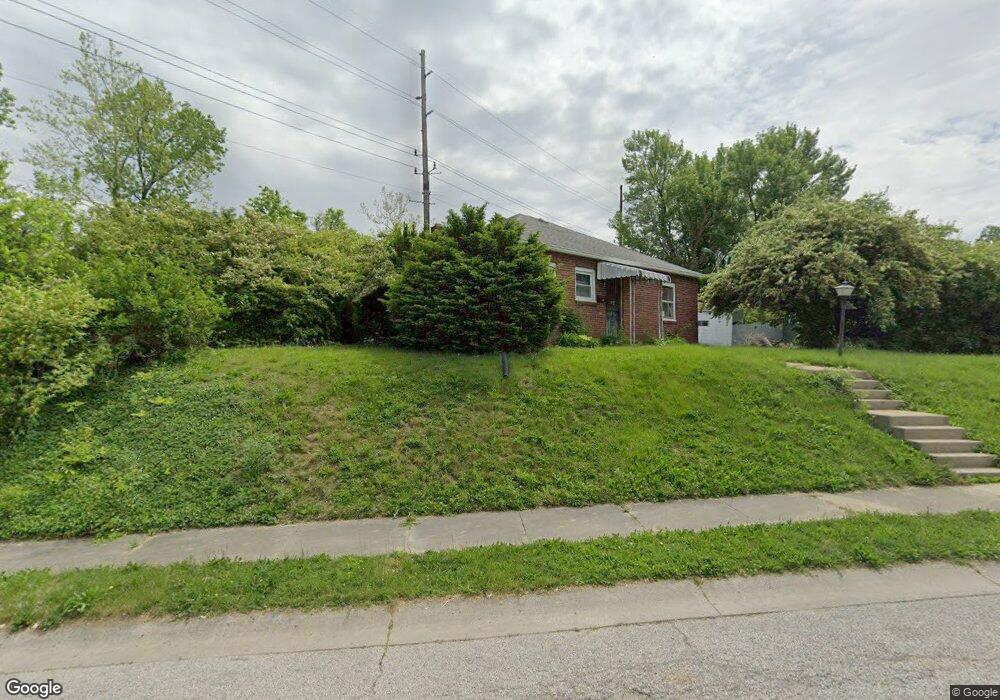
395 N 7th Ave Beech Grove, IN 46107
Estimated Value: $163,000 - $189,000
3
Beds
--
Bath
850
Sq Ft
$214/Sq Ft
Est. Value
About This Home
This home is located at 395 N 7th Ave, Beech Grove, IN 46107 and is currently estimated at $181,823, approximately $213 per square foot. 395 N 7th Ave is a home located in Marion County with nearby schools including Hornet Park Elementary School, Central Elementary School, and South Grove Intermediate School.
Ownership History
Date
Name
Owned For
Owner Type
Purchase Details
Closed on
Aug 12, 2005
Sold by
Hunter Charles W and Estate Of Leonard Earl Arnold
Bought by
Downer Jeffrey P
Current Estimated Value
Home Financials for this Owner
Home Financials are based on the most recent Mortgage that was taken out on this home.
Original Mortgage
$56,900
Outstanding Balance
$28,807
Interest Rate
5.69%
Mortgage Type
New Conventional
Estimated Equity
$153,016
Create a Home Valuation Report for This Property
The Home Valuation Report is an in-depth analysis detailing your home's value as well as a comparison with similar homes in the area
Home Values in the Area
Average Home Value in this Area
Purchase History
| Date | Buyer | Sale Price | Title Company |
|---|---|---|---|
| Downer Jeffrey P | -- | None Available |
Source: Public Records
Mortgage History
| Date | Status | Borrower | Loan Amount |
|---|---|---|---|
| Open | Downer Jeffrey P | $56,900 |
Source: Public Records
Tax History
| Year | Tax Paid | Tax Assessment Tax Assessment Total Assessment is a certain percentage of the fair market value that is determined by local assessors to be the total taxable value of land and additions on the property. | Land | Improvement |
|---|---|---|---|---|
| 2025 | $4,298 | $153,800 | $28,700 | $125,100 |
| 2024 | $4,896 | $156,000 | $28,700 | $127,300 |
| 2023 | $4,896 | $158,900 | $28,700 | $130,200 |
| 2022 | $4,939 | $143,800 | $28,700 | $115,100 |
| 2021 | $3,852 | $123,400 | $28,700 | $94,700 |
| 2020 | $3,519 | $120,200 | $28,700 | $91,500 |
| 2019 | $2,858 | $103,000 | $17,200 | $85,800 |
| 2018 | $2,679 | $95,900 | $17,200 | $78,700 |
| 2017 | $2,938 | $88,800 | $17,200 | $71,600 |
| 2016 | $2,471 | $86,000 | $17,200 | $68,800 |
| 2014 | $2,029 | $86,800 | $17,200 | $69,600 |
| 2013 | $1,010 | $86,800 | $17,200 | $69,600 |
Source: Public Records
Map
Nearby Homes
Your Personal Tour Guide
Ask me questions while you tour the home.