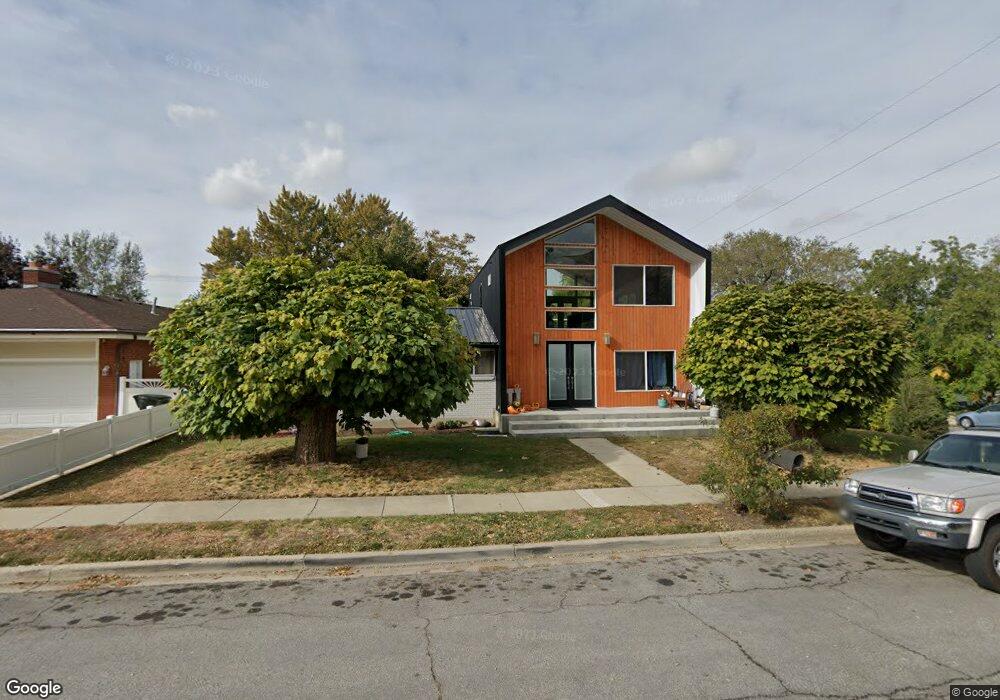
395 N 900 E Bountiful, UT 84010
Estimated Value: $612,000 - $652,000
4
Beds
3
Baths
2,332
Sq Ft
$272/Sq Ft
Est. Value
About This Home
This home is located at 395 N 900 E, Bountiful, UT 84010 and is currently estimated at $634,241, approximately $271 per square foot. 395 N 900 E is a home located in Davis County with nearby schools including Holbrook Elementary School, Millcreek Junior High School, and Bountiful High School.
Ownership History
Date
Name
Owned For
Owner Type
Purchase Details
Closed on
May 14, 1998
Sold by
Williams David E and Williams Joy
Bought by
Hansen R Brandon and Hansen Andrea
Current Estimated Value
Home Financials for this Owner
Home Financials are based on the most recent Mortgage that was taken out on this home.
Original Mortgage
$110,000
Outstanding Balance
$20,936
Interest Rate
7.13%
Estimated Equity
$613,305
Purchase Details
Closed on
Aug 14, 1997
Sold by
Williams David E and Williams Joy
Bought by
Williams David E and Williams Joy
Purchase Details
Closed on
Aug 12, 1997
Sold by
Querciagrossa Peter and Querciagrossa Margaret
Bought by
Williams David E and Williams Joy
Create a Home Valuation Report for This Property
The Home Valuation Report is an in-depth analysis detailing your home's value as well as a comparison with similar homes in the area
Purchase History
| Date | Buyer | Sale Price | Title Company |
|---|---|---|---|
| Hansen R Brandon | -- | Western States Title Company | |
| Williams David E | -- | Bonneville Title Company Inc | |
| Williams David E | -- | Bonneville Title Company Inc |
Source: Public Records
Mortgage History
| Date | Status | Borrower | Loan Amount |
|---|---|---|---|
| Open | Hansen R Brandon | $110,000 | |
| Closed | Hansen R Brandon | $37,325 |
Source: Public Records
Tax History
| Year | Tax Paid | Tax Assessment Tax Assessment Total Assessment is a certain percentage of the fair market value that is determined by local assessors to be the total taxable value of land and additions on the property. | Land | Improvement |
|---|---|---|---|---|
| 2025 | $3,994 | $335,500 | $114,218 | $221,282 |
| 2024 | $3,688 | $326,700 | $105,498 | $221,202 |
| 2023 | $3,566 | $571,000 | $188,817 | $382,183 |
| 2022 | $3,964 | $345,400 | $100,202 | $245,198 |
| 2021 | $2,445 | $339,000 | $148,721 | $190,279 |
| 2020 | $2,345 | $301,000 | $135,473 | $165,527 |
| 2019 | $2,294 | $299,000 | $138,997 | $160,003 |
| 2018 | $2,082 | $273,000 | $128,353 | $144,647 |
| 2016 | $1,704 | $118,800 | $38,774 | $80,026 |
| 2015 | $1,678 | $110,385 | $40,815 | $69,570 |
| 2014 | $1,642 | $110,919 | $40,815 | $70,104 |
| 2013 | -- | $84,524 | $49,531 | $34,993 |
Source: Public Records
Map
Nearby Homes
- 129 N 800 E
- 683 E 100 N
- 6 N 800 E
- 908 Northern Hills Dr Unit 3
- 513 N 400 E Unit 14B
- 933 Northern Hills Cir
- 1138 Briggs Dr
- 453 N 400 E Unit 7-D
- 456 E 500 S
- 978 N 170 E
- 520 S Orchard Dr Unit 17
- 1342 E Skyline Dr N Unit 30
- 255 E 400 S
- 49 E 200 N Unit 4
- 41 E 200 N Unit 6
- 17 E 400 N Unit 19B
- 55 E 200 N Unit 2
- 51 E 200 N Unit 3
- 214 E 1250 N
- 256 N Main St
Your Personal Tour Guide
Ask me questions while you tour the home.