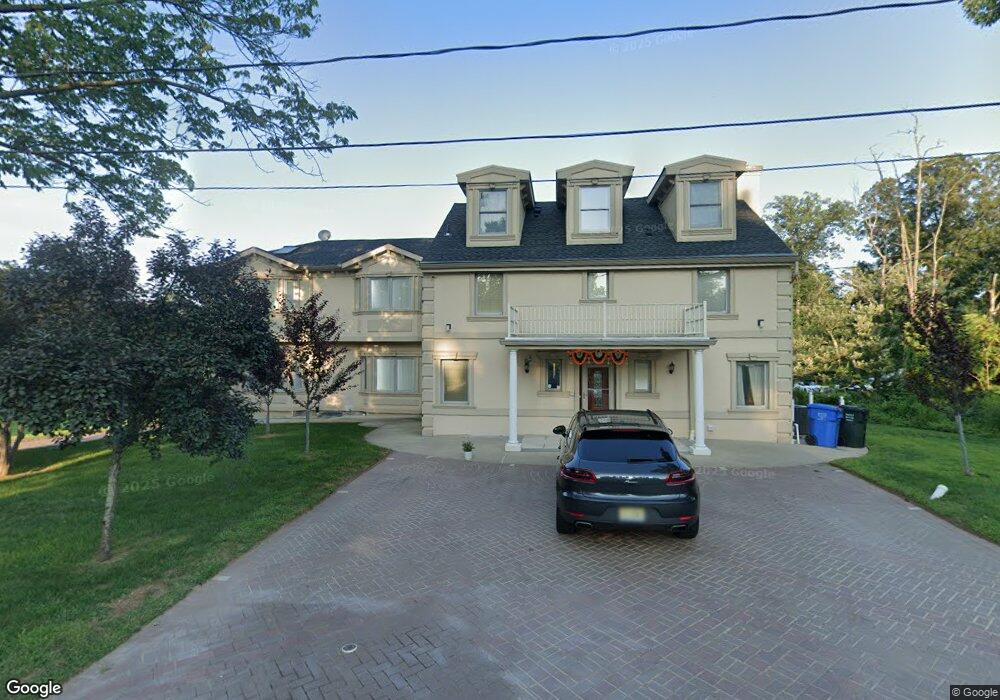
395 New Dover Rd Colonia, NJ 07067
Estimated Value: $905,725 - $1,607,000
--
Bed
--
Bath
5,480
Sq Ft
$235/Sq Ft
Est. Value
About This Home
This home is located at 395 New Dover Rd, Colonia, NJ 07067 and is currently estimated at $1,289,181, approximately $235 per square foot. 395 New Dover Rd is a home located in Middlesex County with nearby schools including Kennedy Park School, Iselin Middle School, and John F. Kennedy Memorial High School.
Ownership History
Date
Name
Owned For
Owner Type
Purchase Details
Closed on
May 3, 2011
Sold by
Patel Jagdish
Bought by
Petel Kishan and Patel Sweta
Current Estimated Value
Purchase Details
Closed on
Feb 9, 2009
Sold by
Patel Jagdish and Patel Nayana
Bought by
Patel Kishan J
Purchase Details
Closed on
Apr 3, 2003
Sold by
Flugrad George
Bought by
Patel Jagdish and Patel Nayana
Home Financials for this Owner
Home Financials are based on the most recent Mortgage that was taken out on this home.
Original Mortgage
$480,000
Outstanding Balance
$207,567
Interest Rate
5.84%
Estimated Equity
$1,081,614
Purchase Details
Closed on
Dec 21, 1995
Sold by
Gorecki Roman
Bought by
Dlugrad George
Home Financials for this Owner
Home Financials are based on the most recent Mortgage that was taken out on this home.
Original Mortgage
$175,000
Interest Rate
7.13%
Create a Home Valuation Report for This Property
The Home Valuation Report is an in-depth analysis detailing your home's value as well as a comparison with similar homes in the area
Home Values in the Area
Average Home Value in this Area
Purchase History
| Date | Buyer | Sale Price | Title Company |
|---|---|---|---|
| Petel Kishan | -- | None Available | |
| Patel Kishan J | -- | None Available | |
| Patel Jagdish | $600,000 | -- | |
| Dlugrad George | $280,000 | -- |
Source: Public Records
Mortgage History
| Date | Status | Borrower | Loan Amount |
|---|---|---|---|
| Open | Patel Jagdish | $480,000 | |
| Previous Owner | Dlugrad George | $175,000 |
Source: Public Records
Tax History Compared to Growth
Tax History
| Year | Tax Paid | Tax Assessment Tax Assessment Total Assessment is a certain percentage of the fair market value that is determined by local assessors to be the total taxable value of land and additions on the property. | Land | Improvement |
|---|---|---|---|---|
| 2025 | $38,106 | $315,500 | $77,100 | $238,400 |
| 2024 | $37,292 | $315,500 | $77,100 | $238,400 |
| 2023 | $37,292 | $315,500 | $77,100 | $238,400 |
| 2022 | $36,377 | $315,500 | $77,100 | $238,400 |
| 2021 | $36,033 | $315,500 | $77,100 | $238,400 |
| 2020 | $34,938 | $315,500 | $77,100 | $238,400 |
| 2019 | $34,080 | $315,500 | $77,100 | $238,400 |
| 2018 | $33,415 | $315,500 | $77,100 | $238,400 |
| 2017 | $32,815 | $315,500 | $77,100 | $238,400 |
| 2016 | $32,544 | $315,500 | $77,100 | $238,400 |
| 2015 | $31,992 | $315,500 | $77,100 | $238,400 |
| 2014 | $31,301 | $315,500 | $77,100 | $238,400 |
Source: Public Records
Map
Nearby Homes
- 42 Harrow Dr
- 403 New Dover Rd
- 399 Middlesex Ave
- 14 Parson Place
- 16 Stafford Rd
- 82 Ravine Dr
- 27 Eagle St
- 80 Berkley Ave
- 147 Warwick St
- 266 Amherst Ave
- 178 N Grant Ave
- 53 Sterling Dr
- 54 Montrose Ave
- 237 E George Place
- 47 Marlboro Ln
- 39 Marlboro Ln
- 212 E Louis Place
- 199 E Louis Place
- 36 Fiume St
- 265 Correja Ave
- 26 Knollwood Ln
- 397 New Dover Rd
- 21 Knollwood Ln
- 392 New Dover Rd
- 399 New Dover Rd
- 390 New Dover Rd
- 0 New Dover Rd
- 330 New Dover Rd Unit 1.01
- 330 New Dover Rd
- 2 Dorset Rd
- 396 New Dover Rd
- 4 Dorset Rd
- 4 Dorset Rd Unit 23
- 51 Midwood Way
- 400 New Dover Rd
- 386 New Dover Rd
- 10 Harrow Dr
- 60 Midwood Way
- 495 Middlesex Ave
- 505 Middlesex Ave