395 Pepper Ln Weatherford, TX 76088
Estimated payment $3,095/month
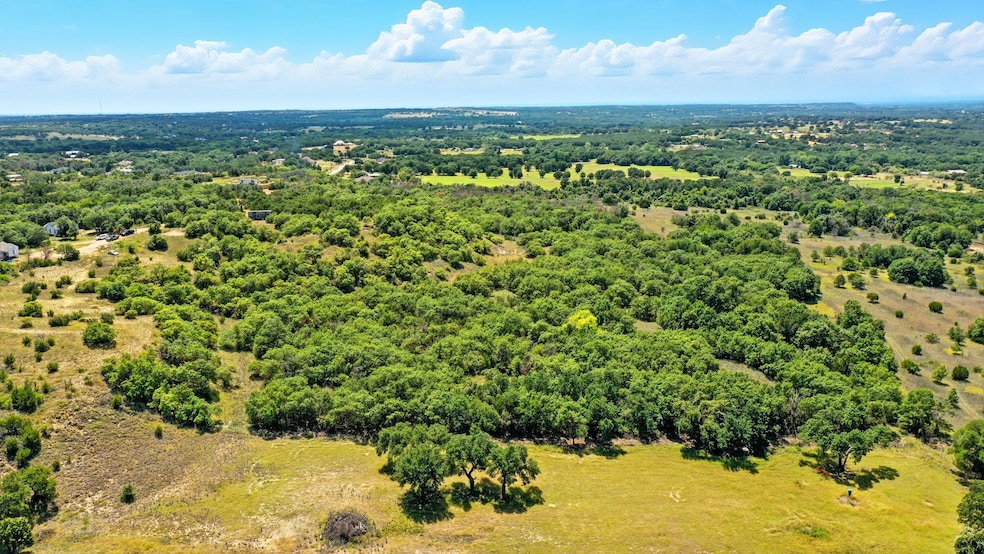
About This Lot
Seize this rare opportunity to own 17 acres of secluded land off Pepper Lane in Peaster ISD, perfect for developers, investors, or a private estate. With ample space for a multi-home subdivision, luxury estate, or hunting getaway, this property offers several possibilities. Easy access to 1885 with utilities nearby, it’s an ideal canvas for your vision. Whether you're looking to develop or create a private retreat, this property offers the perfect blend of space, potential, privacy, and location. Property will have common sense restrictions attached to it. Seller is willing to explore creative ownership or partnership opportunities as well as discuss best access.
Listing Agent
Michael Moos
Trinity Country Real Estate License #0757237 Listed on: 10/16/2025

Property Details
Property Type
- Land
Est. Annual Taxes
- $4,882
Lot Details
- Few Trees
- Current uses include agriculture, hunting/fishing
Map
Home Values in the Area
Average Home Value in this Area
Tax History
| Year | Tax Paid | Tax Assessment Tax Assessment Total Assessment is a certain percentage of the fair market value that is determined by local assessors to be the total taxable value of land and additions on the property. | Land | Improvement |
|---|---|---|---|---|
| 2025 | $4,882 | $382,517 | -- | -- |
| 2024 | $4,882 | $347,743 | -- | -- |
| 2023 | $4,882 | $316,130 | $0 | $0 |
| 2022 | $5,732 | $293,090 | $40,000 | $253,090 |
| 2021 | $5,252 | $293,090 | $40,000 | $253,090 |
| 2020 | $4,871 | $237,520 | $13,500 | $224,020 |
| 2019 | $4,696 | $237,520 | $13,500 | $224,020 |
| 2018 | $4,281 | $198,100 | $13,500 | $184,600 |
| 2017 | $4,260 | $198,100 | $13,500 | $184,600 |
| 2016 | $4,027 | $187,260 | $12,000 | $175,260 |
| 2015 | $3,620 | $187,260 | $12,000 | $175,260 |
| 2014 | $3,849 | $189,370 | $14,000 | $175,370 |
Property History
| Date | Event | Price | List to Sale | Price per Sq Ft |
|---|---|---|---|---|
| 04/08/2025 04/08/25 | Price Changed | $510,000 | -3.2% | -- |
| 02/17/2025 02/17/25 | For Sale | $527,000 | -- | -- |
Purchase History
| Date | Type | Sale Price | Title Company |
|---|---|---|---|
| Deed | -- | -- |
- 217 Jefferson Way
- Lot 3 Suade Way
- Lot 8 Suade Way
- Lot 5 Suade Way
- 233 Jefferson Way
- 121 Norene Ln
- TBD Willow Unit 3B
- TBD Willow Unit 3A
- Lot 6 Suade Way
- Lot 7 Suade Way
- 117 Norene Ln
- Lot 2 Suade Way
- 125 Norene Ln
- Lot 1 Way
- Lot 4 Suade Way
- TBD Willow Unit 1
- 1302 Farm To Market Road 1885
- TBD Mineral Wells Hwy
- 163 Red Fox Ct
- TBD Old Authon Rd
- 401 Old Authon Rd
- 162 Blue Ridge Dr
- 202 Blue Bell Ct
- 2084 Glenhollow Dr
- 484 Clark Lake Rd
- 129 Lindas Creek Ln Unit 129
- 104 Cinnamon Ct
- 136 Cottongame Rd
- 101 Westend Ln
- 1431 Eastview Dr
- 1401 Franklin St
- 302 Case St
- 309 N Dubellette St
- 2112 Tanglewood St Unit 2112
- 1221 Mineral Wells Hwy
- 1201 N Rusk St
- 810 Green Branch Rd
- 604 Fegan St
- 604 E 4th St
- 215 Price Ln Unit 15