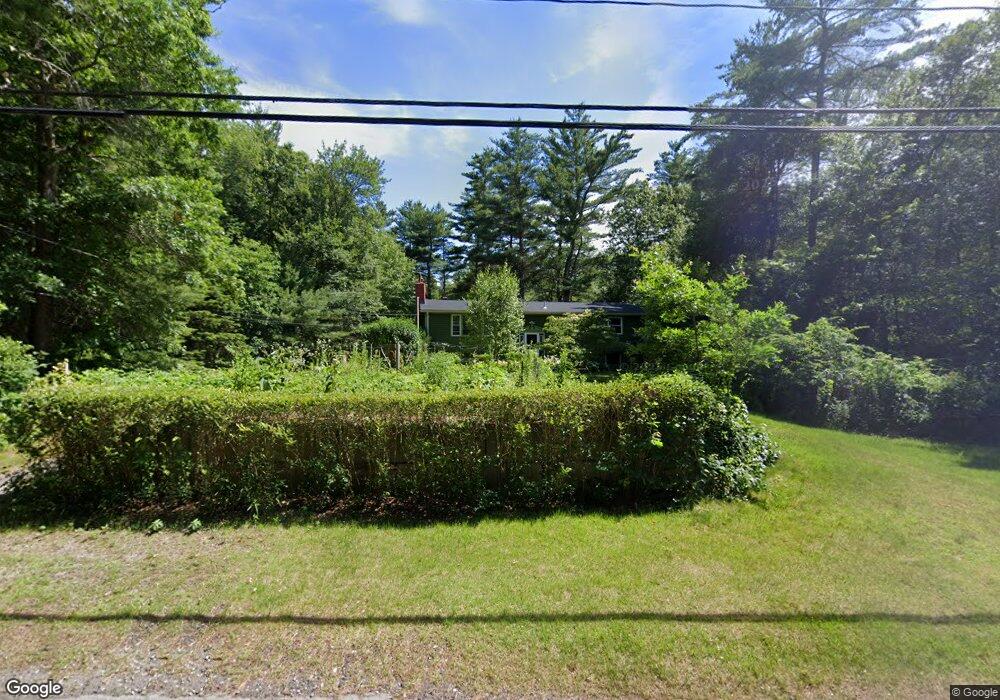
395 River St Halifax, MA 02338
Estimated Value: $432,000 - $576,000
3
Beds
1
Bath
2,042
Sq Ft
$258/Sq Ft
Est. Value
About This Home
This home is located at 395 River St, Halifax, MA 02338 and is currently estimated at $526,645, approximately $257 per square foot. 395 River St is a home located in Plymouth County with nearby schools including Silver Lake Regional High School, Halifax Elementary School, and Silver Lake Regional Middle School.
Ownership History
Date
Name
Owned For
Owner Type
Purchase Details
Closed on
May 11, 2005
Sold by
Lafleur Carline
Bought by
Haugh Robert D
Current Estimated Value
Home Financials for this Owner
Home Financials are based on the most recent Mortgage that was taken out on this home.
Original Mortgage
$226,400
Outstanding Balance
$118,108
Interest Rate
6.05%
Mortgage Type
Purchase Money Mortgage
Estimated Equity
$408,537
Create a Home Valuation Report for This Property
The Home Valuation Report is an in-depth analysis detailing your home's value as well as a comparison with similar homes in the area
Home Values in the Area
Average Home Value in this Area
Purchase History
| Date | Buyer | Sale Price | Title Company |
|---|---|---|---|
| Haugh Robert D | $283,000 | -- |
Source: Public Records
Mortgage History
| Date | Status | Borrower | Loan Amount |
|---|---|---|---|
| Open | Haugh Robert D | $226,400 | |
| Closed | Haugh Robert D | $56,600 | |
| Previous Owner | Haugh Robert D | $10,000 | |
| Previous Owner | Haugh Robert D | $46,000 |
Source: Public Records
Tax History Compared to Growth
Tax History
| Year | Tax Paid | Tax Assessment Tax Assessment Total Assessment is a certain percentage of the fair market value that is determined by local assessors to be the total taxable value of land and additions on the property. | Land | Improvement |
|---|---|---|---|---|
| 2025 | $6,233 | $436,800 | $181,800 | $255,000 |
| 2024 | $6,048 | $420,000 | $174,800 | $245,200 |
| 2023 | $5,815 | $390,800 | $169,700 | $221,100 |
| 2022 | $5,592 | $349,300 | $151,600 | $197,700 |
| 2021 | $5,506 | $316,600 | $145,700 | $170,900 |
| 2020 | $5,293 | $303,500 | $145,700 | $157,800 |
| 2019 | $5,150 | $294,800 | $141,500 | $153,300 |
| 2018 | $4,858 | $278,300 | $133,500 | $144,800 |
| 2017 | $4,916 | $265,300 | $133,500 | $131,800 |
| 2016 | $4,657 | $241,900 | $118,500 | $123,400 |
| 2015 | $4,594 | $241,900 | $118,500 | $123,400 |
Source: Public Records
Map
Nearby Homes
- 8 Hilda Ln
- 0 Morse St Unit 73387111
- 139 Fairway Dr
- 16 Palmer Mill Rd
- 226 Cedar St
- 26 Old Summit St
- 30 West St
- 780 Old Plymouth St
- 266 Monponsett St Unit 1105
- 266 Monponsett St Unit 202
- 266 Monponsett St Unit 307
- 266 Monponsett St Unit 1208
- 266 Monponsett St Unit 103
- 266 Monponsett St Unit 309
- 266 Monponsett St Unit 305
- 266 Monponsett St Unit 1101
- 266 Monponsett St Unit 302
- 266 Monponsett St Unit 303
- 266 Monponsett St Unit 1210
- 266 Monponsett St Unit 203