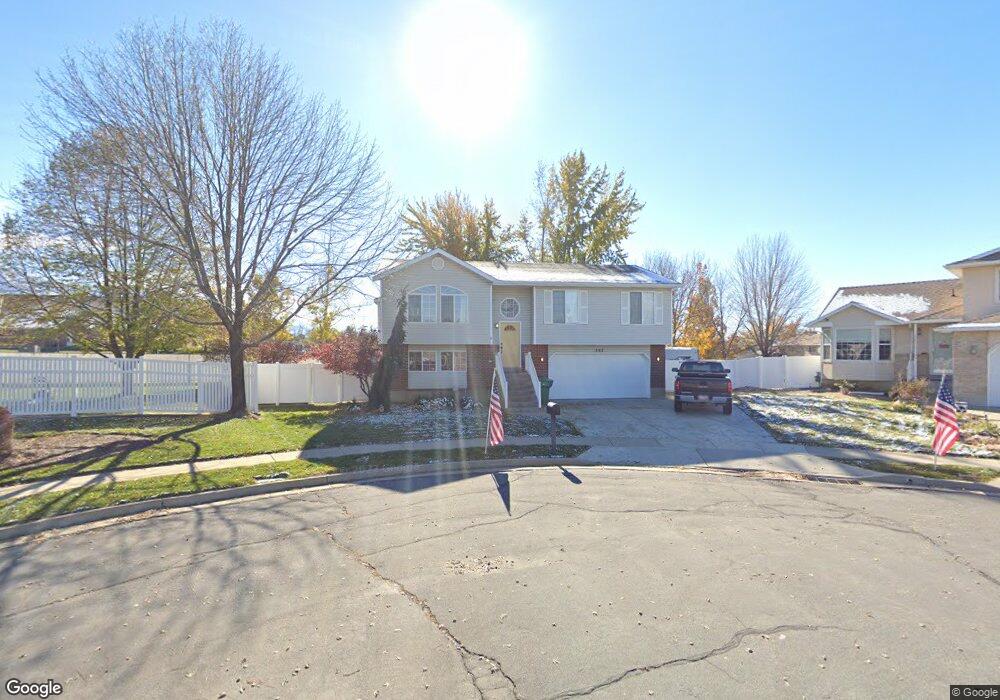
395 S 1050 E Layton, UT 84041
Estimated Value: $481,000 - $518,000
4
Beds
2
Baths
1,964
Sq Ft
$254/Sq Ft
Est. Value
About This Home
This home is located at 395 S 1050 E, Layton, UT 84041 and is currently estimated at $499,132, approximately $254 per square foot. 395 S 1050 E is a home located in Davis County with nearby schools including Creekside Elementary School, Fairfield Junior High School, and Davis High School.
Ownership History
Date
Name
Owned For
Owner Type
Purchase Details
Closed on
Mar 22, 2007
Sold by
Watts R Gregory and Watts Teresa
Bought by
Desmond Gregory L and Desmond Tami E
Current Estimated Value
Purchase Details
Closed on
Oct 27, 1997
Sold by
Woodside Homes Corp
Bought by
Watts R Gregory and Watts Teresa
Home Financials for this Owner
Home Financials are based on the most recent Mortgage that was taken out on this home.
Original Mortgage
$131,256
Interest Rate
7.22%
Mortgage Type
FHA
Create a Home Valuation Report for This Property
The Home Valuation Report is an in-depth analysis detailing your home's value as well as a comparison with similar homes in the area
Home Values in the Area
Average Home Value in this Area
Purchase History
| Date | Buyer | Sale Price | Title Company |
|---|---|---|---|
| Desmond Gregory L | -- | First American Title | |
| Watts R Gregory | -- | First American Title Co |
Source: Public Records
Mortgage History
| Date | Status | Borrower | Loan Amount |
|---|---|---|---|
| Previous Owner | Watts R Gregory | $131,256 |
Source: Public Records
Tax History
| Year | Tax Paid | Tax Assessment Tax Assessment Total Assessment is a certain percentage of the fair market value that is determined by local assessors to be the total taxable value of land and additions on the property. | Land | Improvement |
|---|---|---|---|---|
| 2025 | $2,243 | $235,400 | $105,228 | $130,172 |
| 2024 | $2,148 | $227,150 | $122,416 | $104,734 |
| 2023 | $2,119 | $395,000 | $143,730 | $251,270 |
| 2022 | $2,217 | $224,400 | $76,530 | $147,870 |
| 2021 | $2,100 | $317,000 | $108,783 | $208,217 |
| 2020 | $1,906 | $276,000 | $90,928 | $185,072 |
| 2019 | $1,875 | $266,000 | $85,813 | $180,187 |
| 2018 | $1,671 | $238,000 | $85,813 | $152,187 |
| 2016 | $1,545 | $113,520 | $27,807 | $85,713 |
| 2015 | $1,482 | $103,345 | $27,807 | $75,538 |
| 2014 | $1,522 | $108,522 | $27,807 | $80,715 |
| 2013 | -- | $101,693 | $24,816 | $76,877 |
Source: Public Records
Map
Nearby Homes
- 1368 E 275 S
- 1137 Holmes Creek Ln
- 772 N Crimson Ln
- 679 S Clearwater Falls Dr
- 1328 E Orchard Ridge Ln
- 766 N Stonne Ln
- 680 N Main St Trlr E-11
- 9 Colonial Ave
- 617 E 405 S
- 187 N Talbot Dr
- 524 Hyde Park Ln
- 706 S 600 E
- 895 S Main St Unit E
- 1515 E Gentile St
- 623 E Clearwater Dr Unit 15
- 811 S Main St
- 905 S Main St Unit G
- 917 S Main St Unit H
- 86 Mill Rd
- 464 E Alice Way
Your Personal Tour Guide
Ask me questions while you tour the home.