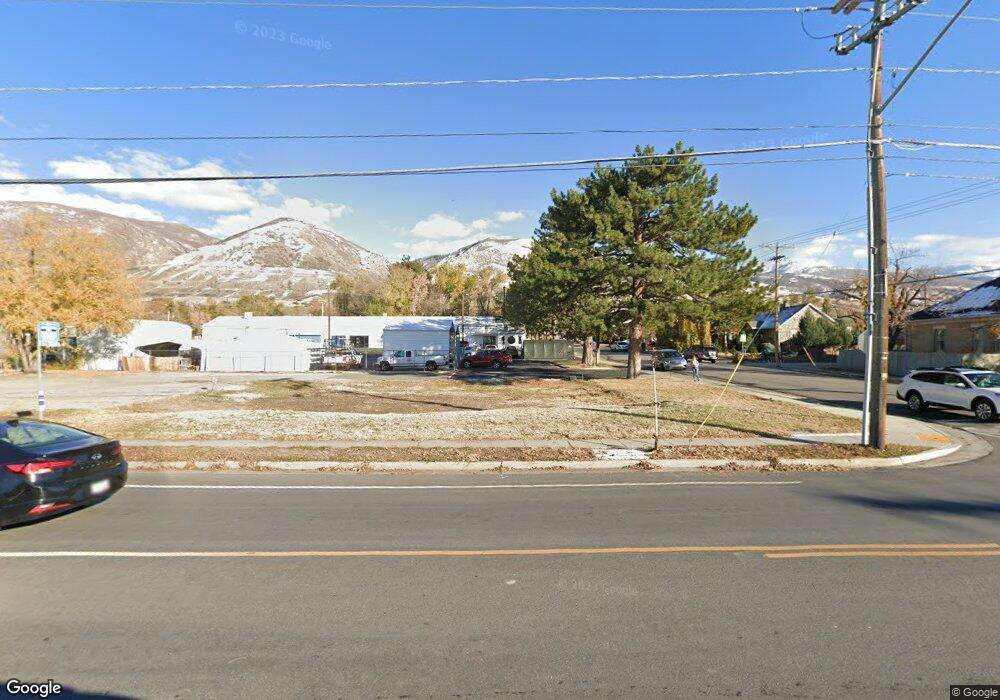
395 S Main St Centerville, UT 84014
Studio
--
Bath
2,338
Sq Ft
13,939
Sq Ft
About This Home
This home is located at 395 S Main St, Centerville, UT 84014. 395 S Main St is a home located in Davis County with nearby schools including J A Taylor Elementary School, Centerville Jr High, and Viewmont High School.
Ownership History
Date
Name
Owned For
Owner Type
Purchase Details
Closed on
Apr 26, 2011
Sold by
Porter Randy S and Porter Judy B
Bought by
King Investment Group Llc
Purchase Details
Closed on
Mar 3, 2005
Sold by
Portor Randy S
Bought by
Potter Rendy S and Potter Judy B
Purchase Details
Closed on
Jan 21, 2004
Sold by
Flanery Timothy W and Flanery Tamra B
Bought by
Porter Randy S
Home Financials for this Owner
Home Financials are based on the most recent Mortgage that was taken out on this home.
Original Mortgage
$147,000
Interest Rate
5.79%
Mortgage Type
Commercial
Purchase Details
Closed on
Sep 10, 1997
Sold by
Perkins Gary T and Perkins Holly
Bought by
Flanery Timothy W and Flanery Tamra B
Home Financials for this Owner
Home Financials are based on the most recent Mortgage that was taken out on this home.
Original Mortgage
$23,000
Interest Rate
7.34%
Mortgage Type
Seller Take Back
Create a Home Valuation Report for This Property
The Home Valuation Report is an in-depth analysis detailing your home's value as well as a comparison with similar homes in the area
Purchase History
| Date | Buyer | Sale Price | Title Company |
|---|---|---|---|
| King Investment Group Llc | -- | First American Title | |
| Potter Rendy S | -- | None Available | |
| Porter Randy S | -- | Executive Title Insurance Ag | |
| Flanery Timothy W | -- | Western States Title Company |
Source: Public Records
Mortgage History
| Date | Status | Borrower | Loan Amount |
|---|---|---|---|
| Previous Owner | Porter Randy S | $147,000 | |
| Previous Owner | Flanery Timothy W | $23,000 | |
| Closed | Flanery Timothy W | $200,000 |
Source: Public Records
Tax History
| Year | Tax Paid | Tax Assessment Tax Assessment Total Assessment is a certain percentage of the fair market value that is determined by local assessors to be the total taxable value of land and additions on the property. | Land | Improvement |
|---|---|---|---|---|
| 2025 | $2,670 | $255,362 | $255,362 | $0 |
| 2024 | $2,364 | $126,496 | $126,496 | $0 |
| 2023 | $2,163 | $114,996 | $114,996 | $0 |
| 2022 | $2,160 | $209,085 | $209,085 | $0 |
| 2021 | $1,938 | $160,715 | $160,715 | $0 |
| 2020 | $1,938 | $160,715 | $160,715 | $0 |
| 2019 | $1,985 | $160,715 | $160,715 | $0 |
| 2018 | $1,490 | $119,180 | $119,180 | $0 |
| 2016 | $2,916 | $235,700 | $119,180 | $116,520 |
| 2015 | $2,295 | $175,000 | $119,180 | $55,820 |
| 2014 | $2,243 | $175,000 | $119,180 | $55,820 |
| 2013 | -- | $175,000 | $119,180 | $55,820 |
Source: Public Records
Map
Nearby Homes
- 88 W 50 S Unit A4
- 88 W 50 S Unit C-3
- 88 W 50 S Unit B5
- 330 W Paradiso Ln
- 345 E 600 S
- 328 E 1100 S
- 360 E Center St
- 83 W 850 S
- 495 E 475 S
- 56 W 200 N
- 967 S Courtyard Ln
- 96 Village Square Rd
- 147 N 360 W Unit 21
- 951 Centerville Commons Way
- 204 Lyman Ln
- 324 S 600 W
- 287 S 680 W Unit 9
- 252 N 400 E
- 380 E 400 N
- 328 W Pages Ln
Your Personal Tour Guide
Ask me questions while you tour the home.