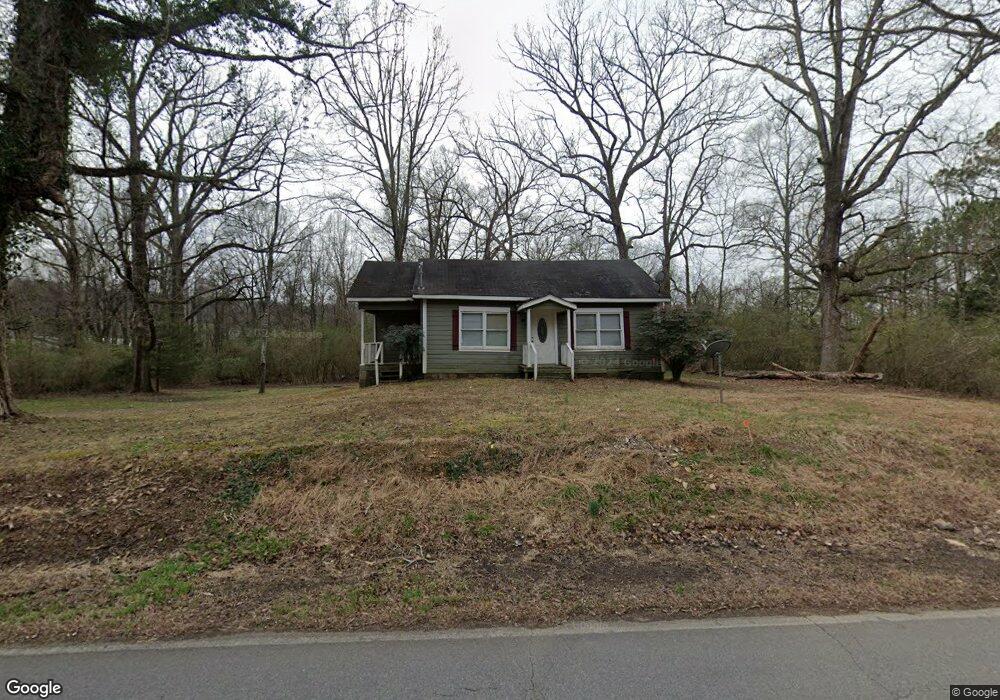
395 Sike Storey Rd Armuchee, GA 30105
Estimated Value: $266,000 - $436,611
7
Beds
1
Bath
1,196
Sq Ft
$286/Sq Ft
Est. Value
About This Home
This home is located at 395 Sike Storey Rd, Armuchee, GA 30105 and is currently estimated at $342,204, approximately $286 per square foot. 395 Sike Storey Rd is a home with nearby schools including Armuchee Middle School and Armuchee High School.
Ownership History
Date
Name
Owned For
Owner Type
Purchase Details
Closed on
Jul 22, 2010
Sold by
Tate Roger L
Bought by
Tate Lori A
Current Estimated Value
Purchase Details
Closed on
Dec 20, 1994
Bought by
P and R
Purchase Details
Closed on
Dec 12, 1994
Bought by
P and R
Purchase Details
Closed on
Dec 9, 1994
Sold by
Selman Billie
Bought by
Brock Rufus H 40 and 64
Purchase Details
Closed on
Oct 20, 1994
Bought by
P and R
Purchase Details
Closed on
Jun 11, 1984
Sold by
Selman Billie
Bought by
Brock Rufus H 5
Purchase Details
Closed on
Apr 12, 1973
Sold by
Selman Billie
Bought by
Brock Rufus and Jean Brock
Purchase Details
Closed on
Sep 25, 1944
Sold by
Selman Jewel Mrs
Bought by
Willingham Tom
Purchase Details
Closed on
Nov 9, 1940
Sold by
Selman Billy
Bought by
Selman Jewel Mrs
Purchase Details
Closed on
Jan 1, 1937
Bought by
Selman Billy
Create a Home Valuation Report for This Property
The Home Valuation Report is an in-depth analysis detailing your home's value as well as a comparison with similar homes in the area
Home Values in the Area
Average Home Value in this Area
Purchase History
| Date | Buyer | Sale Price | Title Company |
|---|---|---|---|
| Tate Lori A | -- | -- | |
| Tate Lori A | -- | -- | |
| P | -- | -- | |
| 16 Tate L | -- | -- | |
| P | -- | -- | |
| P | -- | -- | |
| Tate Roger L | $37,000 | -- | |
| Tate Roger L 3 | $37,000 | -- | |
| Tate Roger L | -- | -- | |
| Selman Billie | -- | -- | |
| P | -- | -- | |
| Brock Rufus H 40 | -- | -- | |
| P | -- | -- | |
| Brock Rufus H 5 | -- | -- | |
| Brock Rufus | -- | -- | |
| Selman Billie | -- | -- | |
| Willingham Tom | -- | -- | |
| Selman Jewel Mrs | -- | -- | |
| Selman Billy | -- | -- |
Source: Public Records
Tax History Compared to Growth
Tax History
| Year | Tax Paid | Tax Assessment Tax Assessment Total Assessment is a certain percentage of the fair market value that is determined by local assessors to be the total taxable value of land and additions on the property. | Land | Improvement |
|---|---|---|---|---|
| 2024 | $4,311 | $122,670 | $104,812 | $17,858 |
| 2023 | $3,510 | $122,048 | $104,812 | $17,236 |
| 2022 | $2,852 | $96,130 | $83,204 | $12,926 |
| 2021 | $2,127 | $70,466 | $59,706 | $10,760 |
| 2020 | $1,918 | $63,013 | $52,836 | $10,177 |
| 2019 | $1,859 | $61,891 | $52,836 | $9,055 |
| 2018 | $1,637 | $54,401 | $45,967 | $8,434 |
| 2017 | $1,630 | $54,053 | $45,967 | $8,086 |
| 2016 | $1,641 | $53,782 | $45,960 | $7,822 |
| 2015 | $1,605 | $53,782 | $45,960 | $7,822 |
| 2014 | $1,605 | $53,782 | $45,960 | $7,822 |
Source: Public Records
Map
Nearby Homes
- 0 Big Texas Valley Rd NW Unit 22112881
- 0 Big Texas Valley Rd NW Unit 10420220
- 6673 Big Texas Valley Rd NW
- 4494 Old Summerville Rd
- 1450 Highway 27
- 70 Old Summerville Rd
- 0 Packer Dairy Rd Unit 10326955
- 12 Scenic Trace Dr NW
- 00 Westvalley Dr
- 0 Westvalley Dr NW Unit 7605181
- 49 Southern Woods Dr NE
- 649 Farmersville Rd
- 5095 Big Texas Valley Rd NW
- 0 Highway 140 Unit 20164671
- 00 Little Texas Valley Rd
- 2051 Little Texas Valley Rd NW
- 1129 Farmersville Rd
- 1162 New Rosedale Rd NE
- 1194 New Rosedale Rd NE
- 1224 Texas Valley Rd NW
- 435 Sike Storey Rd
- 435 Sike Storey Rd
- 465 Sike Storey Rd
- 203 Sike Storey Rd
- 7756 Martha Berry Hwy NE
- 18 Winkle Dr
- 18 Winkle Dr
- 36 Winkle Dr
- 7782 Martha Berry Hwy NE
- 7837 Martha Berry Hwy NE
- 7810 Martha Berry Hwy NE
- 52 Winkle Dr
- 7664 Martha Berry Hwy NE Unit 9999
- 7664 Martha Berry Hwy NE
- 7664 Martha Berry Hwy NE
- 7826 Martha Berry Hwy NE
- 7843 Martha Berry Hwy NE
- 7836 Martha Berry Hwy NE
- 115 Winkle Dr
- 115 Winkle Dr