395 W Log Hill Rd Unit W Pagosa Springs, CO 81147
Estimated Value: $593,000 - $736,000
2
Beds
2
Baths
1,584
Sq Ft
$429/Sq Ft
Est. Value
About This Home
This home is located at 395 W Log Hill Rd Unit W, Pagosa Springs, CO 81147 and is currently estimated at $680,038, approximately $429 per square foot. 395 W Log Hill Rd Unit W is a home located in Archuleta County with nearby schools including Pagosa Springs Elementary School, Pagosa Springs Middle School, and Pagosa Springs High School.
Ownership History
Date
Name
Owned For
Owner Type
Purchase Details
Closed on
Nov 28, 2000
Sold by
Gordon Van
Bought by
Gordon Lee C
Current Estimated Value
Purchase Details
Closed on
Sep 9, 1997
Sold by
Woollends Michael J and Woollends Alice
Bought by
Kingston James E and Kingston Natalie D
Purchase Details
Closed on
Nov 1, 1993
Sold by
Gordon Lee Carl
Bought by
Woollends Michael J and Woollends Alice
Purchase Details
Closed on
Oct 31, 1993
Sold by
Vanlee Gordon Van and Lee Gordon Cherie
Bought by
Gordon Lee Carl
Purchase Details
Closed on
Oct 30, 1993
Sold by
Gordon Lee C & Betty F Estate
Bought by
Gordon Lee Carl and Gordon Ken
Purchase Details
Closed on
Aug 23, 1984
Bought by
Gordon Lee C and Gordon Betty
Purchase Details
Closed on
Aug 1, 1984
Sold by
Keys Charles D
Bought by
Gordon Lee C and Gordon Betty
Purchase Details
Closed on
Oct 24, 1983
Bought by
Davis Geraldine B
Purchase Details
Closed on
Nov 1, 1980
Bought by
Keys Charles D
Create a Home Valuation Report for This Property
The Home Valuation Report is an in-depth analysis detailing your home's value as well as a comparison with similar homes in the area
Home Values in the Area
Average Home Value in this Area
Purchase History
| Date | Buyer | Sale Price | Title Company |
|---|---|---|---|
| Gordon Lee C | -- | -- | |
| Kingston James E | $47,000 | -- | |
| Woollends Michael J | $35,000 | -- | |
| Gordon Lee Carl | -- | -- | |
| Gordon Lee Carl | -- | -- | |
| Gordon Lee C | -- | -- | |
| Gordon Lee C | $26,000 | -- | |
| Davis Geraldine B | -- | -- | |
| Keys Charles D | $22,500 | -- |
Source: Public Records
Tax History Compared to Growth
Tax History
| Year | Tax Paid | Tax Assessment Tax Assessment Total Assessment is a certain percentage of the fair market value that is determined by local assessors to be the total taxable value of land and additions on the property. | Land | Improvement |
|---|---|---|---|---|
| 2024 | $2,355 | $40,610 | $12,920 | $27,690 |
| 2023 | $2,355 | $40,610 | $12,920 | $27,690 |
| 2022 | $1,532 | $24,960 | $7,960 | $17,000 |
| 2021 | $1,605 | $25,680 | $8,190 | $17,490 |
| 2020 | $1,674 | $26,620 | $8,220 | $18,400 |
| 2019 | $1,652 | $26,620 | $8,220 | $18,400 |
| 2018 | $1,458 | $21,540 | $7,920 | $13,620 |
| 2017 | $1,257 | $21,540 | $7,920 | $13,620 |
| 2016 | $1,359 | $23,040 | $10,750 | $12,290 |
| 2015 | -- | $23,040 | $10,750 | $12,290 |
| 2014 | -- | $18,090 | $6,520 | $11,570 |
Source: Public Records
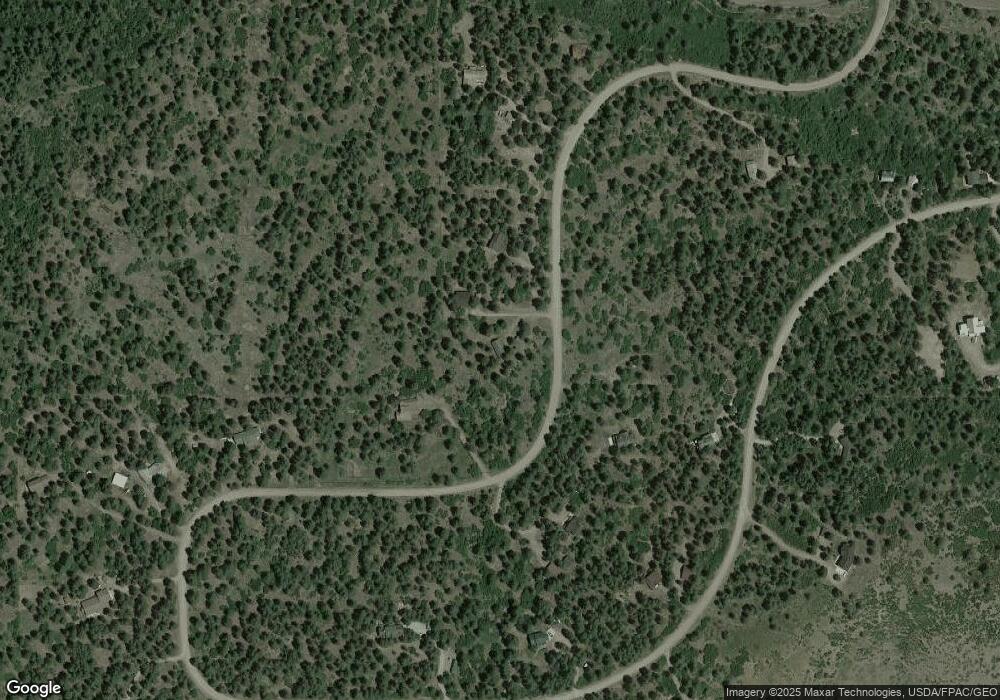
Map
Nearby Homes
- 3051A County Road 200
- 51 Little Beaver Place
- 904 Harman Ave
- 19 Little Beaver Place
- 783 Harman Ave
- 85 Harman Ave
- 104 Bear Mountain Place
- 62 Jackson Ct
- 1001 County Road 200
- TBD Us Hwy 84 & Us Hwy 160
- 351 Collyer Dr
- 199 Chokecherry Glen
- 47 U S 84
- 54 County Road 302
- 2554 County Road 400
- 225 E Pagosa St
- 351 E Pagosa St
- 107 Lewis St
- 1220 County Road 400
- 302 Mesa Dr
- 303 W Log Hill Rd
- 334 W Log Hill Rd
- 402 W Log Hill Rd
- 454 W Log Hill Rd
- 512 W Log Hill Rd
- 387 E Log Hill Rd
- 236 W Log Hill Rd
- 317 E Log Hill Rd
- W Log Hill Rd
- 243 W Log Hill Rd
- 601 W Log Hill Rd
- 787 E Log Hill Rd
- 485 E Log Hill Rd
- 620 W Log Hill Rd
- 587 E Log Hill Rd
- 195 W Log Hill Rd
- 261 E Log Hill Rd
- 679 E Log Hill Rd
- 126 W Log Hill Rd
- 338 E Log Hill Rd