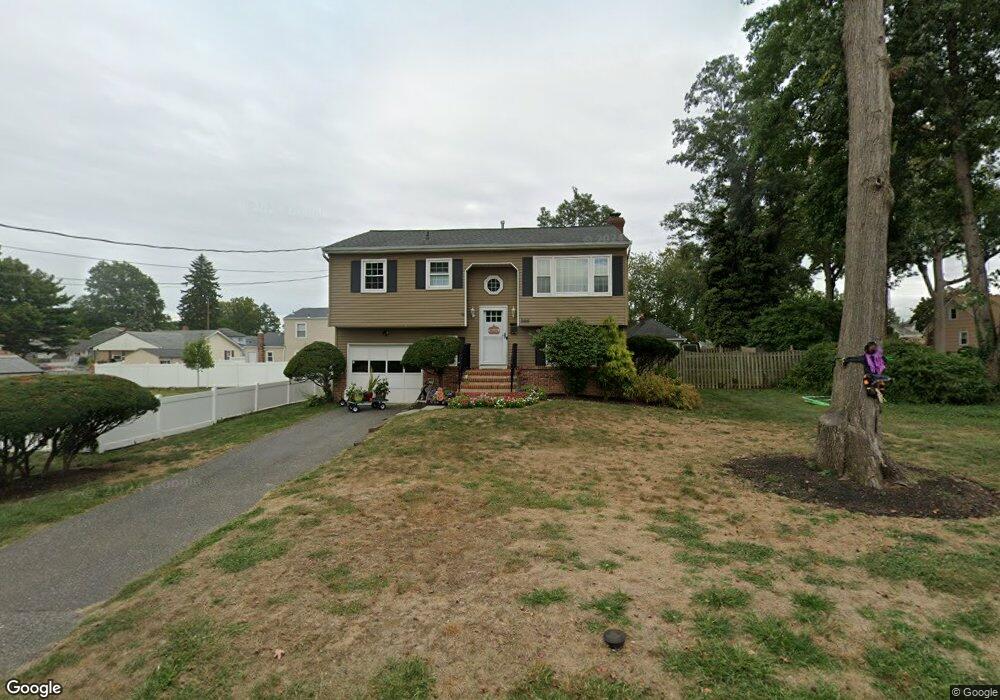
395 Woodbine St Belford, NJ 07718
New Monmouth NeighborhoodEstimated Value: $589,000 - $656,000
3
Beds
2
Baths
1,540
Sq Ft
$402/Sq Ft
Est. Value
About This Home
This home is located at 395 Woodbine St, Belford, NJ 07718 and is currently estimated at $619,014, approximately $401 per square foot. 395 Woodbine St is a home located in Monmouth County with nearby schools including New Monmouth Elementary School, Thorne Middle School, and Middletown High School North.
Ownership History
Date
Name
Owned For
Owner Type
Purchase Details
Closed on
Oct 2, 2012
Sold by
Martin Matthew S and Martin Laka M
Current Estimated Value
Home Financials for this Owner
Home Financials are based on the most recent Mortgage that was taken out on this home.
Original Mortgage
$275,418
Outstanding Balance
$188,367
Interest Rate
3.25%
Mortgage Type
FHA
Estimated Equity
$430,647
Purchase Details
Closed on
Sep 30, 2003
Sold by
Odonnell Steven
Bought by
Martin Matthew and Laka Martin
Home Financials for this Owner
Home Financials are based on the most recent Mortgage that was taken out on this home.
Original Mortgage
$239,900
Interest Rate
5.88%
Purchase Details
Closed on
Aug 14, 2000
Sold by
Walter Sabino
Bought by
Odonnell Steven and Calderon Adriana
Home Financials for this Owner
Home Financials are based on the most recent Mortgage that was taken out on this home.
Original Mortgage
$179,900
Interest Rate
8.13%
Create a Home Valuation Report for This Property
The Home Valuation Report is an in-depth analysis detailing your home's value as well as a comparison with similar homes in the area
Home Values in the Area
Average Home Value in this Area
Purchase History
| Date | Buyer | Sale Price | Title Company |
|---|---|---|---|
| -- | $280,500 | Agent For Chicago Title Insu | |
| Martin Matthew | $299,900 | -- | |
| Odonnell Steven | $199,900 | -- |
Source: Public Records
Mortgage History
| Date | Status | Borrower | Loan Amount |
|---|---|---|---|
| Open | -- | $275,418 | |
| Previous Owner | Martin Matthew | $239,900 | |
| Previous Owner | Odonnell Steven | $179,900 |
Source: Public Records
Tax History Compared to Growth
Tax History
| Year | Tax Paid | Tax Assessment Tax Assessment Total Assessment is a certain percentage of the fair market value that is determined by local assessors to be the total taxable value of land and additions on the property. | Land | Improvement |
|---|---|---|---|---|
| 2025 | $8,251 | $581,300 | $362,400 | $218,900 |
| 2024 | $7,559 | $501,600 | $280,700 | $220,900 |
| 2023 | $7,559 | $434,900 | $230,200 | $204,700 |
| 2022 | $7,540 | $404,100 | $202,000 | $202,100 |
| 2021 | $7,540 | $362,500 | $190,000 | $172,500 |
| 2020 | $7,526 | $352,000 | $181,000 | $171,000 |
| 2019 | $7,041 | $333,400 | $174,000 | $159,400 |
| 2018 | $7,285 | $336,200 | $165,000 | $171,200 |
| 2017 | $7,246 | $331,000 | $165,000 | $166,000 |
| 2016 | $6,297 | $295,500 | $155,000 | $140,500 |
| 2015 | $6,500 | $294,500 | $155,000 | $139,500 |
| 2014 | $6,393 | $282,500 | $155,000 | $127,500 |
Source: Public Records
Map
Nearby Homes