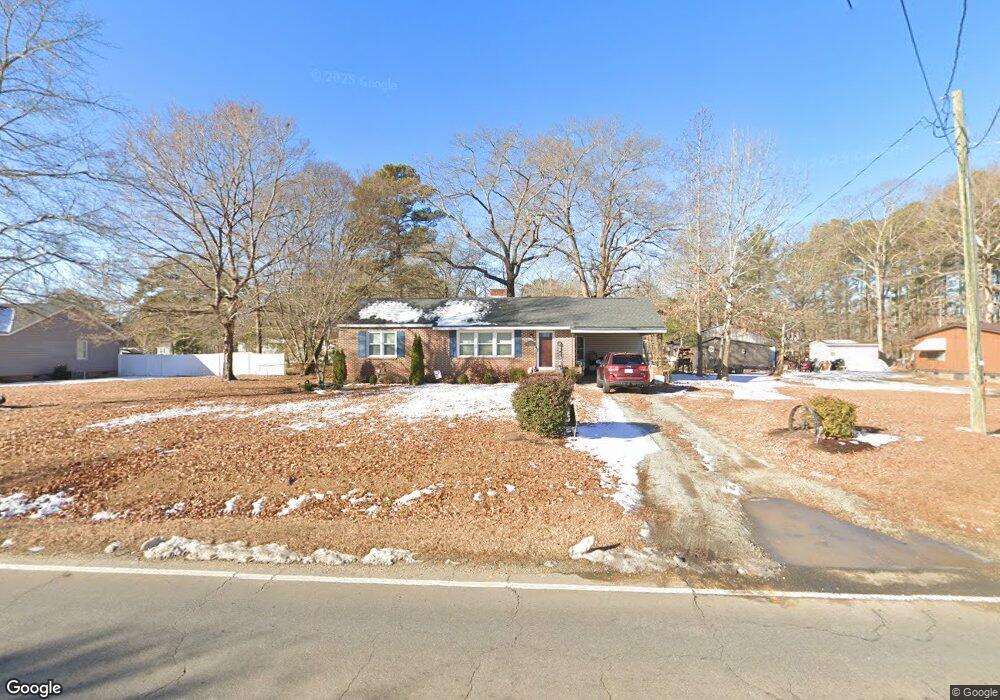
395 Zoo Rd S Roanoke Rapids, NC 27870
Estimated Value: $84,195 - $182,000
2
Beds
1
Bath
936
Sq Ft
$135/Sq Ft
Est. Value
About This Home
This home is located at 395 Zoo Rd S, Roanoke Rapids, NC 27870 and is currently estimated at $126,549, approximately $135 per square foot. 395 Zoo Rd S is a home located in Halifax County with nearby schools including Everetts Elementary School, William R. Davie Middle School, and Northwest Halifax High School.
Ownership History
Date
Name
Owned For
Owner Type
Purchase Details
Closed on
Sep 28, 2017
Sold by
Pierce John F
Bought by
Pierce John F and Rhodes Kathryn
Current Estimated Value
Purchase Details
Closed on
Mar 21, 2006
Sold by
Harrison Lavernia
Bought by
Pierce John E and Pierce Emma L
Home Financials for this Owner
Home Financials are based on the most recent Mortgage that was taken out on this home.
Original Mortgage
$46,320
Outstanding Balance
$26,271
Interest Rate
6.23%
Mortgage Type
New Conventional
Estimated Equity
$100,278
Purchase Details
Closed on
Mar 8, 2006
Sold by
Harvey Marie Parker and Harvey James R
Bought by
Harrison Lavernia
Home Financials for this Owner
Home Financials are based on the most recent Mortgage that was taken out on this home.
Original Mortgage
$46,320
Outstanding Balance
$26,271
Interest Rate
6.23%
Mortgage Type
New Conventional
Estimated Equity
$100,278
Purchase Details
Closed on
May 2, 2005
Sold by
Harrison Earnest W
Bought by
Harrison Lavernia
Create a Home Valuation Report for This Property
The Home Valuation Report is an in-depth analysis detailing your home's value as well as a comparison with similar homes in the area
Home Values in the Area
Average Home Value in this Area
Purchase History
| Date | Buyer | Sale Price | Title Company |
|---|---|---|---|
| Pierce John F | -- | None Available | |
| Pierce John E | $58,000 | None Available | |
| Pierce John F | $10,000 | None Available | |
| Harrison Lavernia | -- | None Available | |
| Harrison Lavernia | -- | None Available |
Source: Public Records
Mortgage History
| Date | Status | Borrower | Loan Amount |
|---|---|---|---|
| Open | Pierce John F | $46,320 | |
| Closed | Pierce John E | $46,320 |
Source: Public Records
Tax History Compared to Growth
Tax History
| Year | Tax Paid | Tax Assessment Tax Assessment Total Assessment is a certain percentage of the fair market value that is determined by local assessors to be the total taxable value of land and additions on the property. | Land | Improvement |
|---|---|---|---|---|
| 2025 | $8 | $57,800 | $8,100 | $49,700 |
| 2024 | $8 | $57,800 | $8,100 | $49,700 |
| 2023 | $752 | $55,000 | $8,100 | $46,900 |
| 2022 | $769 | $55,000 | $8,100 | $46,900 |
| 2021 | $743 | $55,000 | $8,100 | $46,900 |
| 2020 | $747 | $55,000 | $8,100 | $46,900 |
| 2019 | $727 | $52,300 | $8,100 | $44,200 |
| 2018 | $726 | $52,300 | $8,100 | $44,200 |
| 2017 | $715 | $52,300 | $8,100 | $44,200 |
| 2016 | $672 | $52,300 | $8,100 | $44,200 |
| 2015 | $632 | $52,300 | $8,100 | $44,200 |
| 2014 | $531 | $43,260 | $9,820 | $33,440 |
Source: Public Records
Map
Nearby Homes
- 217 Easton St
- 62 Hickory Cir
- 63 Hickory Cir
- 40 Green Ash Ct
- 38 Green Ash Ct
- 39 Green Ash Ct
- 21 Bald Eagle Dr
- 25 Bald Eagle Dr
- 29 Bald Eagle Dr
- 31 Bald Eagle Dr
- 33 Bald Eagle Dr
- 37 Bald Eagle Dr
- 35 Bald Eagle Dr
- 24 Bald Eagle Dr
- 26 Bald Eagle Dr
- 28 Bald Eagle Dr
- 32 Bald Eagle Dr
- 34 Bald Eagle Dr
- 36 Bald Eagle Dr
- 415 Hales Branch Dr