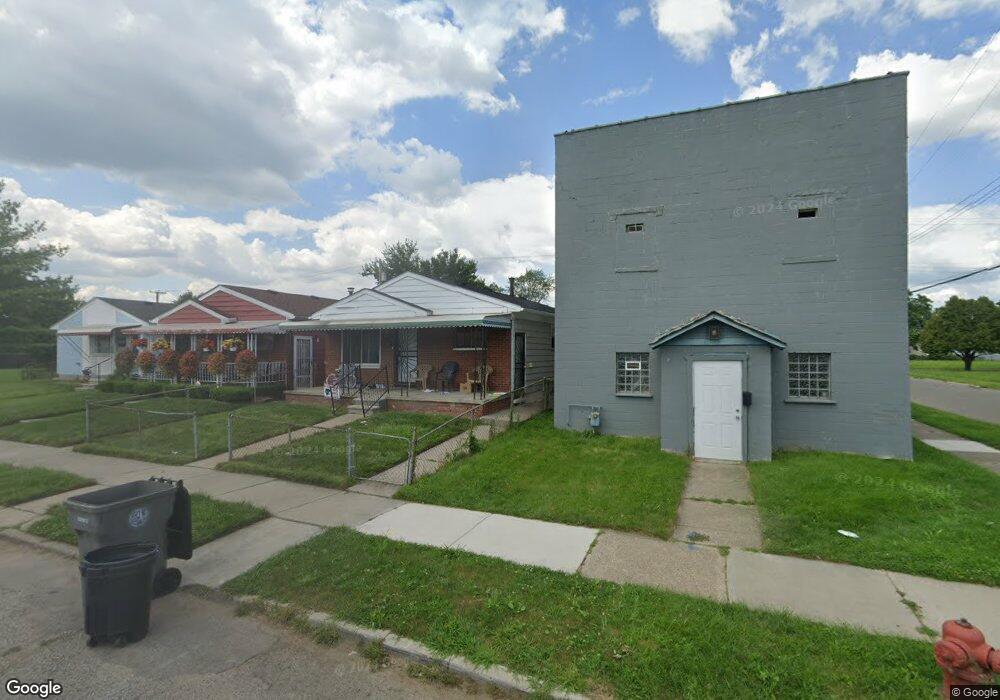
3950 9th St Ecorse, MI 48229
Estimated Value: $74,000 - $81,000
--
Bed
--
Bath
876
Sq Ft
$89/Sq Ft
Est. Value
About This Home
This home is located at 3950 9th St, Ecorse, MI 48229 and is currently estimated at $77,984, approximately $89 per square foot. 3950 9th St is a home located in Wayne County with nearby schools including Ralph J. Bunche Elementary, Grandport Academy, and Ecorse High School.
Ownership History
Date
Name
Owned For
Owner Type
Purchase Details
Closed on
Feb 14, 2022
Sold by
Jackson Yvonne J and Jackson Jessie J
Bought by
Berry Latasha
Current Estimated Value
Purchase Details
Closed on
Mar 26, 2014
Sold by
Jackson Jesse J and Jackson Yvonne
Bought by
Jackson Jesse J and Jackson Yvonne
Purchase Details
Closed on
Apr 13, 2005
Sold by
Jackson Jesse J
Bought by
Jackson Jesse and Jackson Yvonne
Home Financials for this Owner
Home Financials are based on the most recent Mortgage that was taken out on this home.
Original Mortgage
$69,825
Interest Rate
6.07%
Mortgage Type
Stand Alone Refi Refinance Of Original Loan
Create a Home Valuation Report for This Property
The Home Valuation Report is an in-depth analysis detailing your home's value as well as a comparison with similar homes in the area
Home Values in the Area
Average Home Value in this Area
Purchase History
| Date | Buyer | Sale Price | Title Company |
|---|---|---|---|
| Berry Latasha | -- | None Listed On Document | |
| Jackson Jesse J | -- | None Available | |
| Jackson Jesse | -- | Nations Title Agency Of Mi |
Source: Public Records
Mortgage History
| Date | Status | Borrower | Loan Amount |
|---|---|---|---|
| Previous Owner | Jackson Jesse | $69,825 |
Source: Public Records
Tax History Compared to Growth
Tax History
| Year | Tax Paid | Tax Assessment Tax Assessment Total Assessment is a certain percentage of the fair market value that is determined by local assessors to be the total taxable value of land and additions on the property. | Land | Improvement |
|---|---|---|---|---|
| 2025 | $650 | $33,900 | $0 | $0 |
| 2024 | $650 | $29,700 | $0 | $0 |
| 2023 | $619 | $25,900 | $0 | $0 |
| 2022 | $1,198 | $20,800 | $0 | $0 |
| 2021 | $1,227 | $17,200 | $0 | $0 |
| 2019 | $1,188 | $12,600 | $0 | $0 |
| 2018 | $557 | $10,300 | $0 | $0 |
| 2017 | $1,223 | $10,600 | $0 | $0 |
| 2016 | $1,218 | $10,900 | $0 | $0 |
| 2013 | $2,160 | $22,700 | $0 | $0 |
| 2012 | $939 | $23,500 | $2,600 | $20,900 |
Source: Public Records
Map
Nearby Homes