Estimated Value: $413,689 - $527,000
3
Beds
3
Baths
2,596
Sq Ft
$181/Sq Ft
Est. Value
About This Home
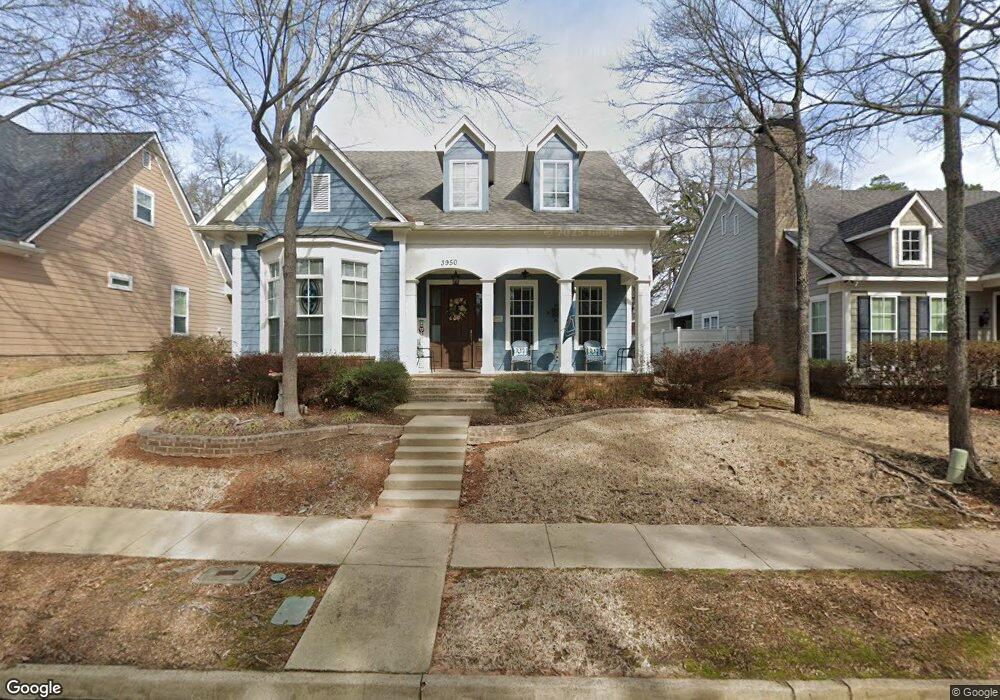
This home is located at 3950 Charleston Park, Tyler, TX 75701 and is currently estimated at $469,172, approximately $180 per square foot. 3950 Charleston Park is a home located in Smith County with nearby schools including Kissam Intermediate School, Jackson Elementary School, and Chapel Hill Middle School.
Ownership History
Date
Name
Owned For
Owner Type
Purchase Details
Closed on
Jun 30, 2017
Sold by
Landess Malcolm L
Bought by
Mohon James and Mohon Susan
Current Estimated Value
Purchase Details
Closed on
Mar 18, 2015
Sold by
Root Georgia Ann
Bought by
Landess Malcolm L
Home Financials for this Owner
Home Financials are based on the most recent Mortgage that was taken out on this home.
Original Mortgage
$274,122
Interest Rate
3.6%
Mortgage Type
New Conventional
Purchase Details
Closed on
Jul 7, 2008
Sold by
Cbg Root Construction Llc
Bought by
Root Georgia Ann
Home Financials for this Owner
Home Financials are based on the most recent Mortgage that was taken out on this home.
Original Mortgage
$61,852
Interest Rate
5.99%
Mortgage Type
Purchase Money Mortgage
Create a Home Valuation Report for This Property
The Home Valuation Report is an in-depth analysis detailing your home's value as well as a comparison with similar homes in the area
Home Values in the Area
Average Home Value in this Area
Purchase History
| Date | Buyer | Sale Price | Title Company |
|---|---|---|---|
| Mohon James | -- | None Available | |
| Landess Malcolm L | -- | None Available | |
| Root Georgia Ann | -- | None Available |
Source: Public Records
Mortgage History
| Date | Status | Borrower | Loan Amount |
|---|---|---|---|
| Previous Owner | Landess Malcolm L | $274,122 | |
| Previous Owner | Root Georgia Ann | $61,852 |
Source: Public Records
Tax History Compared to Growth
Tax History
| Year | Tax Paid | Tax Assessment Tax Assessment Total Assessment is a certain percentage of the fair market value that is determined by local assessors to be the total taxable value of land and additions on the property. | Land | Improvement |
|---|---|---|---|---|
| 2025 | $3,133 | $414,455 | $28,892 | $385,563 |
| 2024 | $3,133 | $403,224 | $44,100 | $389,657 |
| 2023 | $6,922 | $430,524 | $44,100 | $386,424 |
| 2022 | $6,000 | $333,243 | $44,100 | $289,143 |
| 2021 | $5,998 | $316,870 | $44,100 | $272,770 |
| 2020 | $5,833 | $299,025 | $44,100 | $254,925 |
| 2019 | $5,819 | $289,267 | $44,100 | $245,167 |
| 2018 | $5,638 | $281,917 | $36,750 | $245,167 |
| 2017 | $6,849 | $342,446 | $36,750 | $305,696 |
| 2016 | $6,485 | $324,244 | $36,750 | $287,494 |
| 2015 | $5,832 | $318,267 | $36,750 | $281,517 |
| 2014 | $5,832 | $318,267 | $36,750 | $281,517 |
Source: Public Records
Map
Nearby Homes
- 3913 Belle Mere St
- 3950 Hanover Place
- 3962 Hanover Place
- 4021 Hanover Place
- 4025 Hanover Place
- 4029 Hanover Place
- 2527 Westminster Dr
- 4024 Hanover Place
- 2613 Chelsea Dr
- 4037 Hanover Place
- 2216 Gish Ln
- 3109 Campus Cir
- 3108 Williamsburg Cir
- 3606 Trailwood Ct
- 3205 Timberlane Dr
- 8226 County Road 219
- 3618 Trailwood Ct
- 3617 Flagstone Dr
- 2902 Shenandoah Dr
- 10130 State Highway 64 E
- 3950 3950 Charleston Park
- 3954 Charleston Park
- 3946 Charleston Park
- 3942 Charleston Park
- 3958 Charleston Park
- 3942 3942 Charleston Park
- 3958 3958 Charleston Park
- 3933 Belle Mere St
- 3949 3949 Charleston Park
- 3927 Belle Mere St
- 3949 Charleston Park
- 3953 3953 Charleston Park
- 3938 3938 Charleston Park
- 3953 Charleston Park
- 3962 Charleston Park
- 3923 Belle Mere St
- 3937 Charleston Park
- 3957 Charleston Park
- 2804 Wakefield Dr
- 3966 Charleston Park