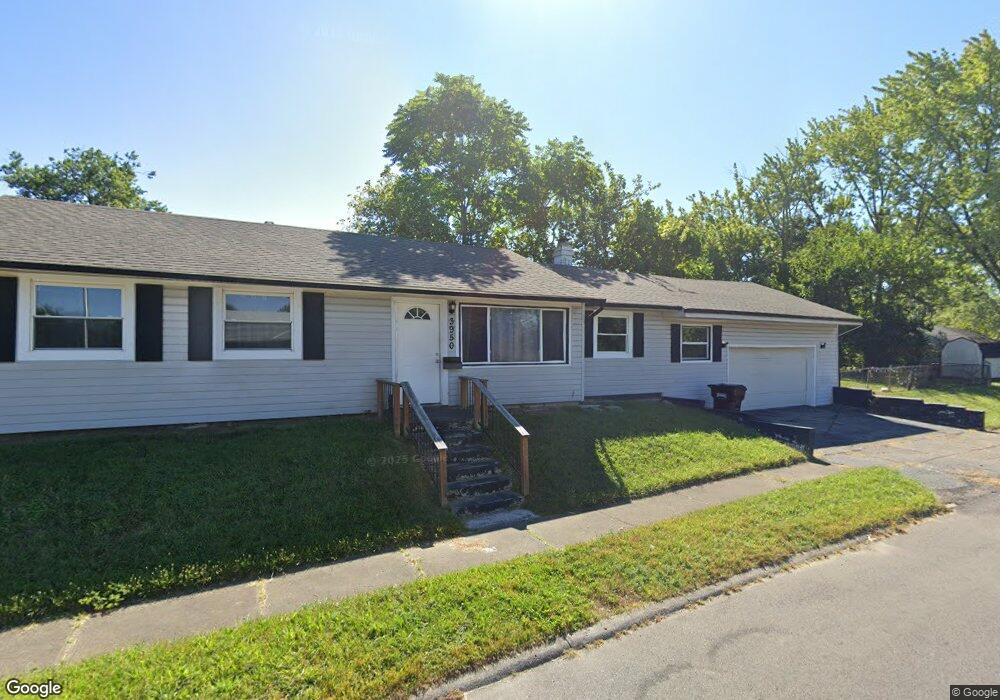
3950 Myron Ave Dayton, OH 45416
Estimated Value: $108,000 - $121,000
3
Beds
1
Bath
1,425
Sq Ft
$80/Sq Ft
Est. Value
About This Home
This home is located at 3950 Myron Ave, Dayton, OH 45416 and is currently estimated at $114,114, approximately $80 per square foot. 3950 Myron Ave is a home located in Montgomery County with nearby schools including Valerie Elementary School, Imagine Klepinger Road Community School, and North Dayton School of Science & Discovery.
Ownership History
Date
Name
Owned For
Owner Type
Purchase Details
Closed on
Jul 29, 2019
Sold by
Octagon Holdings Llc
Bought by
Central Homes Llc
Current Estimated Value
Home Financials for this Owner
Home Financials are based on the most recent Mortgage that was taken out on this home.
Original Mortgage
$3,511,000
Outstanding Balance
$3,074,987
Interest Rate
3.7%
Mortgage Type
Commercial
Estimated Equity
-$2,960,873
Purchase Details
Closed on
Nov 7, 2016
Sold by
Bayview Loan Services Llc
Bought by
Octagon Holdings Llc
Home Financials for this Owner
Home Financials are based on the most recent Mortgage that was taken out on this home.
Original Mortgage
$35,000
Interest Rate
3.42%
Mortgage Type
Purchase Money Mortgage
Purchase Details
Closed on
Apr 21, 2016
Sold by
Johnson Katina Y and Johnson Kevin
Bought by
Bayview Loan Servicing Llc
Create a Home Valuation Report for This Property
The Home Valuation Report is an in-depth analysis detailing your home's value as well as a comparison with similar homes in the area
Home Values in the Area
Average Home Value in this Area
Purchase History
| Date | Buyer | Sale Price | Title Company |
|---|---|---|---|
| Central Homes Llc | -- | Performance Title Inc | |
| Octagon Holdings Llc | $14,000 | Nations Lending Services | |
| Bayview Loan Servicing Llc | -- | None Available |
Source: Public Records
Mortgage History
| Date | Status | Borrower | Loan Amount |
|---|---|---|---|
| Open | Central Homes Llc | $3,511,000 | |
| Previous Owner | Octagon Holdings Llc | $35,000 |
Source: Public Records
Tax History Compared to Growth
Tax History
| Year | Tax Paid | Tax Assessment Tax Assessment Total Assessment is a certain percentage of the fair market value that is determined by local assessors to be the total taxable value of land and additions on the property. | Land | Improvement |
|---|---|---|---|---|
| 2024 | $1,218 | $19,400 | $2,910 | $16,490 |
| 2023 | $1,218 | $19,400 | $2,910 | $16,490 |
| 2022 | $1,385 | $16,390 | $2,460 | $13,930 |
| 2021 | $1,379 | $16,390 | $2,460 | $13,930 |
| 2020 | $1,375 | $16,390 | $2,460 | $13,930 |
| 2019 | $875 | $9,240 | $2,460 | $6,780 |
| 2018 | $1,199 | $9,240 | $2,460 | $6,780 |
| 2017 | $870 | $9,240 | $2,460 | $6,780 |
| 2016 | $1,405 | $14,780 | $2,460 | $12,320 |
| 2015 | $1,338 | $14,780 | $2,460 | $12,320 |
| 2014 | $1,338 | $14,780 | $2,460 | $12,320 |
| 2012 | -- | $16,580 | $3,300 | $13,280 |
Source: Public Records
Map
Nearby Homes
- 4703 Natchez Ave
- 4472 Curundu Ave
- 4322 Annapolis Ave
- 4237 Nevada Ave
- 4104 Brenton Dr
- 4616 Channing Ln
- 3709 Mandalay Dr
- 4235 Merryfield Ave
- 4534 Fairgreen Dr
- 4534 N Fairgreen Ave
- 3462 Arlene Ave
- 4831 Free Pike
- 4131 Merryfield Ave
- 3678 Wilmore St
- 4228 Molane St
- 5224 Heatherton Dr
- Lot#14 Bridgeport Dr
- Lot#15 Bridgeport Dr
- LOT#26 Glenbrook Dr
- 4431 Wolf Rd
- 4440 Natchez Ave
- 4436 Natchez Ave
- 3951 Myron Ave
- 4432 Natchez Ave
- 3926 Myron Ave
- 4441 Annapolis Ave
- 4552 Natchez Ave
- 4428 Natchez Ave
- 4437 Annapolis Ave
- 3925 Myron Ave
- 3976 Myron Ave
- 4441 Natchez Ave
- 4433 Annapolis Ave
- 4537 Natchez Ave
- 4551 Annapolis Ave
- 4564 Natchez Ave
- 4424 Natchez Ave
- 4551 Natchez Ave
- 4420 Natchez Ave
- 4425 Annapolis Ave