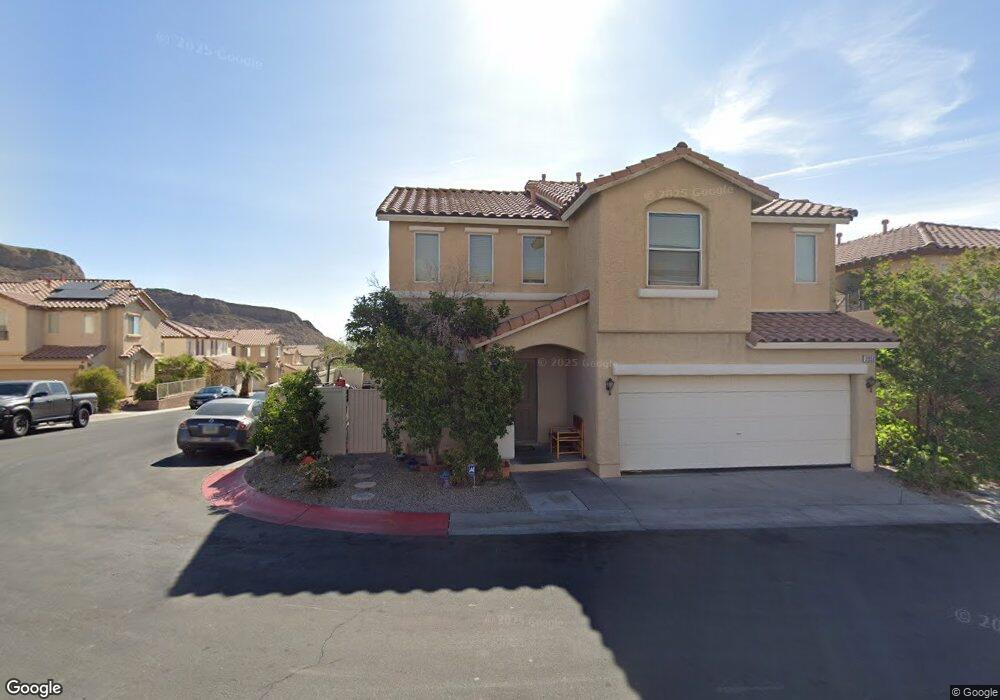
3950 Philomena St Las Vegas, NV 89129
Lone Mountain NeighborhoodEstimated Value: $393,000 - $476,000
3
Beds
3
Baths
1,937
Sq Ft
$220/Sq Ft
Est. Value
About This Home
This home is located at 3950 Philomena St, Las Vegas, NV 89129 and is currently estimated at $426,686, approximately $220 per square foot. 3950 Philomena St is a home located in Clark County with nearby schools including Eileen Conners Elementary School, Justice Myron E Leavitt Middle School, and Centennial High School.
Ownership History
Date
Name
Owned For
Owner Type
Purchase Details
Closed on
May 24, 2011
Sold by
Deutsche Bank National Trust Company
Bought by
Kaimimoku Marquis P and Kaimimoku Terrena A E
Current Estimated Value
Home Financials for this Owner
Home Financials are based on the most recent Mortgage that was taken out on this home.
Original Mortgage
$100,160
Interest Rate
4.5%
Mortgage Type
New Conventional
Purchase Details
Closed on
Mar 7, 2011
Sold by
Sumpter John E
Bought by
Deutsche Bank National Trust Company
Purchase Details
Closed on
Aug 4, 2004
Sold by
Richmond American Homes Of Nevada Inc
Bought by
Sumpter John E
Home Financials for this Owner
Home Financials are based on the most recent Mortgage that was taken out on this home.
Original Mortgage
$251,650
Interest Rate
6.17%
Mortgage Type
Unknown
Create a Home Valuation Report for This Property
The Home Valuation Report is an in-depth analysis detailing your home's value as well as a comparison with similar homes in the area
Home Values in the Area
Average Home Value in this Area
Purchase History
| Date | Buyer | Sale Price | Title Company |
|---|---|---|---|
| Kaimimoku Marquis P | $125,200 | Servicelink Irvine | |
| Deutsche Bank National Trust Company | $116,645 | Fidelity Natl Title Ins Co | |
| Sumpter John E | $279,643 | Stewart Title Of Nevada |
Source: Public Records
Mortgage History
| Date | Status | Borrower | Loan Amount |
|---|---|---|---|
| Previous Owner | Kaimimoku Marquis P | $100,160 | |
| Previous Owner | Sumpter John E | $251,650 |
Source: Public Records
Tax History Compared to Growth
Tax History
| Year | Tax Paid | Tax Assessment Tax Assessment Total Assessment is a certain percentage of the fair market value that is determined by local assessors to be the total taxable value of land and additions on the property. | Land | Improvement |
|---|---|---|---|---|
| 2025 | $2,548 | $109,829 | $31,850 | $77,979 |
| 2024 | $3,332 | $109,829 | $31,850 | $77,979 |
| 2023 | $3,332 | $103,263 | $29,750 | $73,513 |
| 2022 | $2,374 | $90,529 | $23,450 | $67,079 |
| 2021 | $4,206 | $84,725 | $21,000 | $63,725 |
| 2020 | $1,616 | $84,114 | $21,000 | $63,114 |
| 2019 | $1,515 | $80,110 | $18,200 | $61,910 |
| 2018 | $1,445 | $72,821 | $13,650 | $59,171 |
| 2017 | $2,375 | $72,440 | $12,600 | $59,840 |
| 2016 | $1,605 | $60,745 | $10,150 | $50,595 |
| 2015 | $1,844 | $51,077 | $8,400 | $42,677 |
| 2014 | $1,606 | $41,911 | $5,250 | $36,661 |
Source: Public Records
Map
Nearby Homes
- 3929 Philomena St
- 10365 Cherokee Corner Ave
- 3908 Badgerbrook St
- 3935 Legend Hills St Unit 104
- 10290 Gilmore Canyon Ct Unit 103
- 10425 Denali Ridge Ct
- 3930 Legend Hills St Unit 102
- 3920 Legend Hills St Unit 202
- 3945 Bayamon St
- 3915 Palm Beach St Unit 201
- 4033 Baxter Peak St
- 10231 Delray Beach Ave Unit 201
- 10221 Delray Beach Ave Unit 201
- 10429 Chandra Ave
- 10400 Coyote Cub Ave
- 10404 Coyote Cub Ave
- 10476 Wellington Manor Ave Unit 5
- 3908 Total Eclipse St
- 10191 Deerfield Beach Ave Unit 202
- 10190 Deerfield Beach Ave Unit 202
- 3946 Philomena St
- 10355 Faustine Ave
- 3942 Philomena St
- 10368 Faustine Ave
- 3953 Philomena St
- 10351 Faustine Ave
- 3941 Philomena St
- 3957 Philomena St
- 10347 Faustine Ave
- 10356 Faustine Ave
- 3934 Philomena St
- 3938 Philomena St
- 3937 Philomena St
- 10364 Faustine Ave
- 3949 Philomena St
- 3945 Philomena St
- 10352 Faustine Ave
- 3961 Philomena St
- 10360 Faustine Ave
- 3969 Philomena St