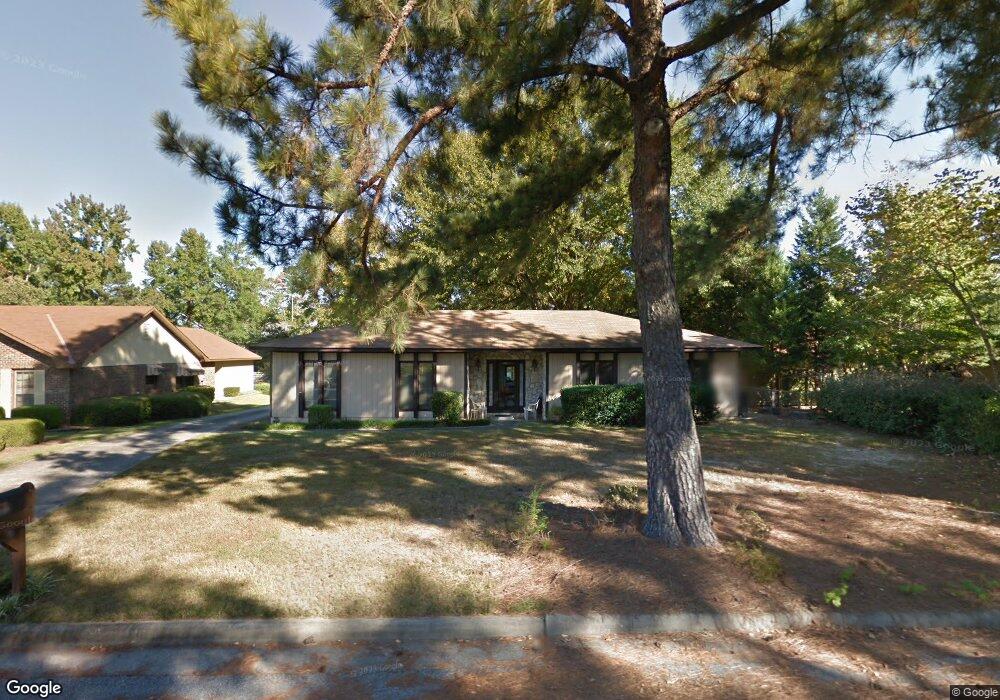
3951 Eve Ct Columbus, GA 31909
Northern Columbus NeighborhoodEstimated Value: $231,000 - $269,000
4
Beds
3
Baths
1,870
Sq Ft
$134/Sq Ft
Est. Value
About This Home
This home is located at 3951 Eve Ct, Columbus, GA 31909 and is currently estimated at $250,119, approximately $133 per square foot. 3951 Eve Ct is a home located in Muscogee County with nearby schools including Blanchard Elementary School, Veterans Memorial Middle School, and Hardaway High School.
Ownership History
Date
Name
Owned For
Owner Type
Purchase Details
Closed on
Jun 12, 2017
Sold by
Bunt David William
Bought by
Kane Shannon N
Current Estimated Value
Home Financials for this Owner
Home Financials are based on the most recent Mortgage that was taken out on this home.
Original Mortgage
$147,283
Outstanding Balance
$123,762
Interest Rate
4.4%
Mortgage Type
FHA
Estimated Equity
$126,357
Purchase Details
Closed on
May 9, 2016
Sold by
Bunt William Harris
Bought by
Bunt David William and Bunt Karabasz Amy
Purchase Details
Closed on
Sep 16, 2013
Sold by
Bunt William Harris
Bought by
Bunt William Harris
Create a Home Valuation Report for This Property
The Home Valuation Report is an in-depth analysis detailing your home's value as well as a comparison with similar homes in the area
Home Values in the Area
Average Home Value in this Area
Purchase History
| Date | Buyer | Sale Price | Title Company |
|---|---|---|---|
| Kane Shannon N | $150,000 | -- | |
| Bunt David William | -- | -- | |
| Bunt William Harris | -- | -- |
Source: Public Records
Mortgage History
| Date | Status | Borrower | Loan Amount |
|---|---|---|---|
| Open | Kane Shannon N | $147,283 |
Source: Public Records
Tax History Compared to Growth
Tax History
| Year | Tax Paid | Tax Assessment Tax Assessment Total Assessment is a certain percentage of the fair market value that is determined by local assessors to be the total taxable value of land and additions on the property. | Land | Improvement |
|---|---|---|---|---|
| 2025 | $165 | $69,508 | $10,604 | $58,904 |
| 2024 | $1,651 | $69,508 | $10,604 | $58,904 |
| 2023 | $968 | $69,508 | $10,604 | $58,904 |
| 2022 | $1,722 | $58,428 | $10,604 | $47,824 |
| 2021 | $1,715 | $55,400 | $10,604 | $44,796 |
| 2020 | $1,716 | $55,400 | $10,604 | $44,796 |
| 2019 | $1,723 | $55,400 | $10,604 | $44,796 |
| 2018 | $1,723 | $55,400 | $10,604 | $44,796 |
| 2017 | $2,277 | $55,400 | $10,604 | $44,796 |
| 2016 | $1,612 | $39,079 | $5,135 | $33,944 |
| 2015 | $338 | $39,079 | $5,135 | $33,944 |
| 2014 | $339 | $39,079 | $5,135 | $33,944 |
| 2013 | -- | $39,079 | $5,135 | $33,944 |
Source: Public Records
Map
Nearby Homes
- 6200 Karen Ct
- 6104 Candlestick Loop
- 3824 Lyn Dr
- 3732 Arrel Dr
- 4036 Wilbur Dr
- 5829 Moon Rd
- 6221 Charing Dr
- 3919 Gray Fox Dr
- 4320 Canady St
- 6158 Arrington Dr
- 22 Nettle Ct
- 4245 N Oaks Dr
- 5836 Sherborne Dr
- 3325 N North Quay Dr
- 6717 Moon Cir
- 6138 Seaton Dr
- 5817 Sherborne Dr
- 5921 Lawson St
- 3710 Winkfield Place
- 5915 Frazier Dr