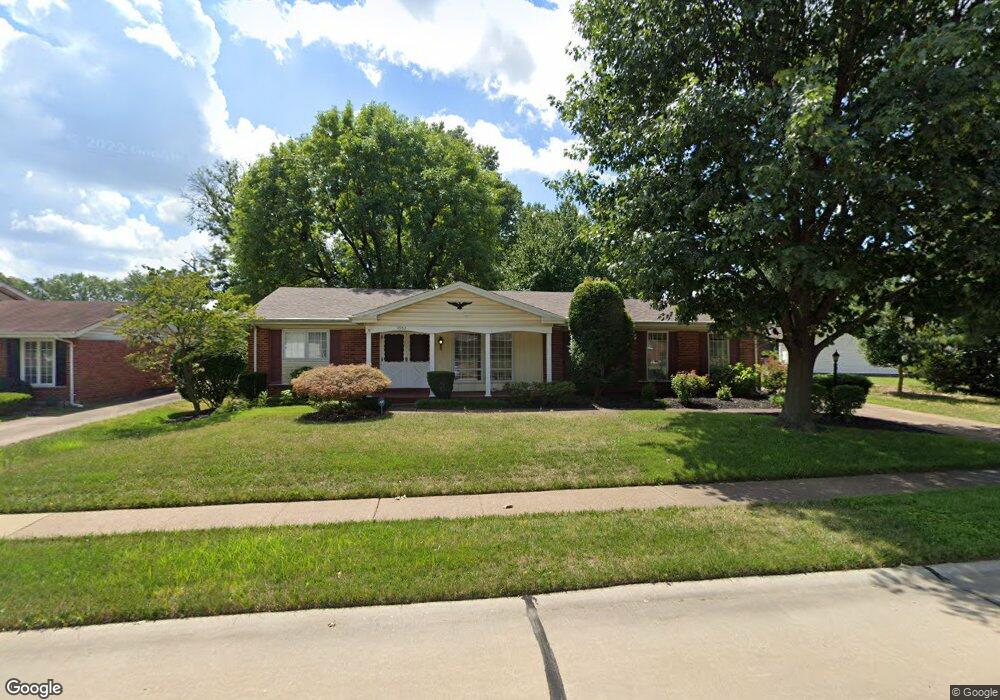
3952 Fieldstone Dr Florissant, MO 63033
Estimated Value: $208,661 - $253,000
3
Beds
2
Baths
1,450
Sq Ft
$162/Sq Ft
Est. Value
About This Home
This home is located at 3952 Fieldstone Dr, Florissant, MO 63033 and is currently estimated at $234,915, approximately $162 per square foot. 3952 Fieldstone Dr is a home located in St. Louis County with nearby schools including Commons Lane Elementary School, Cross Keys Middle School, and McCluer North High School.
Ownership History
Date
Name
Owned For
Owner Type
Purchase Details
Closed on
Mar 9, 2020
Sold by
Sanders Tanya R
Bought by
Goolsby Michael J
Current Estimated Value
Home Financials for this Owner
Home Financials are based on the most recent Mortgage that was taken out on this home.
Original Mortgage
$140,500
Outstanding Balance
$124,196
Interest Rate
3.4%
Mortgage Type
New Conventional
Estimated Equity
$110,719
Purchase Details
Closed on
Nov 2, 2006
Sold by
Agnew James W and Revocab Patricia
Bought by
Goolsby Michael J and Sanders Tanya R
Home Financials for this Owner
Home Financials are based on the most recent Mortgage that was taken out on this home.
Original Mortgage
$170,000
Interest Rate
6.26%
Mortgage Type
Purchase Money Mortgage
Purchase Details
Closed on
Aug 14, 2000
Sold by
Agnew James W and Agnew Patricia A
Bought by
Liv James W and Liv Patricia
Create a Home Valuation Report for This Property
The Home Valuation Report is an in-depth analysis detailing your home's value as well as a comparison with similar homes in the area
Home Values in the Area
Average Home Value in this Area
Purchase History
| Date | Buyer | Sale Price | Title Company |
|---|---|---|---|
| Goolsby Michael J | -- | Orntic St Louis | |
| Goolsby Michael J | $170,000 | None Available | |
| Liv James W | -- | -- |
Source: Public Records
Mortgage History
| Date | Status | Borrower | Loan Amount |
|---|---|---|---|
| Open | Goolsby Michael J | $140,500 | |
| Closed | Goolsby Michael J | $170,000 |
Source: Public Records
Tax History Compared to Growth
Tax History
| Year | Tax Paid | Tax Assessment Tax Assessment Total Assessment is a certain percentage of the fair market value that is determined by local assessors to be the total taxable value of land and additions on the property. | Land | Improvement |
|---|---|---|---|---|
| 2025 | $2,434 | $35,310 | $4,810 | $30,500 |
| 2024 | $2,434 | $30,760 | $5,530 | $25,230 |
| 2023 | $2,420 | $30,760 | $5,530 | $25,230 |
| 2022 | $2,350 | $26,200 | $6,460 | $19,740 |
| 2021 | $2,237 | $26,200 | $6,460 | $19,740 |
| 2020 | $2,035 | $22,170 | $5,530 | $16,640 |
| 2019 | $1,994 | $22,170 | $5,530 | $16,640 |
| 2018 | $1,806 | $18,020 | $3,330 | $14,690 |
| 2017 | $1,796 | $18,020 | $3,330 | $14,690 |
| 2016 | $1,560 | $15,170 | $2,950 | $12,220 |
| 2015 | $1,567 | $15,170 | $2,950 | $12,220 |
| 2014 | $2,183 | $21,150 | $4,960 | $16,190 |
Source: Public Records
Map
Nearby Homes
- 3940 Parker Rd
- 12415 Danube Dr
- 3 Wild Ridge Estates Turnberry Ct
- 4244 Miletus Dr
- 0TBB Wild Ridge Hazeltine
- 0 Wild Ridge Sawgrass
- 0 Wild Ridge Pikewood Unit MAR23017155
- 0 Wild Ridge Pikewood Unit MAR23017151
- LOT 32 Wild Ridge Willowbrook
- 0TBB Wild Ridge Bethpage
- 0LOT Wild Ridge Turnberry
- 2 Wild Ridge Sawgrass
- Lot 8 Wild Ridge Hazeltine
- 0TBB Wild Ridge Sawgrass
- 8 Wild Ridge Bethpage
- 7 Wild Ridge Willowbrook
- 1 Wild Ridge Sawgrass
- 5 Wild Ridge Willowbrook
- 4 Wild Ridge Bethpage
- 12 Wild Ridge Hazeltine
- 3972 Fieldstone Dr
- 3922 Fieldstone Dr
- 3953 Browning Dr
- 3973 Browning Dr
- 3992 Fieldstone Dr
- 3971 Fieldstone Dr
- 3933 Browning Dr
- 3981 Fieldstone Dr
- 3961 Fieldstone Dr
- 3993 Browning Dr
- 3991 Fieldstone Dr
- 4012 Fieldstone Dr
- 3931 Fieldstone Dr
- 3951 Fieldstone Dr
- 3921 Fieldstone Dr
- 4003 Browning Dr
- 3941 Fieldstone Dr
- 3911 Fieldstone Dr
- 3974 Browning Dr
- 12925 Royal Oak Dr