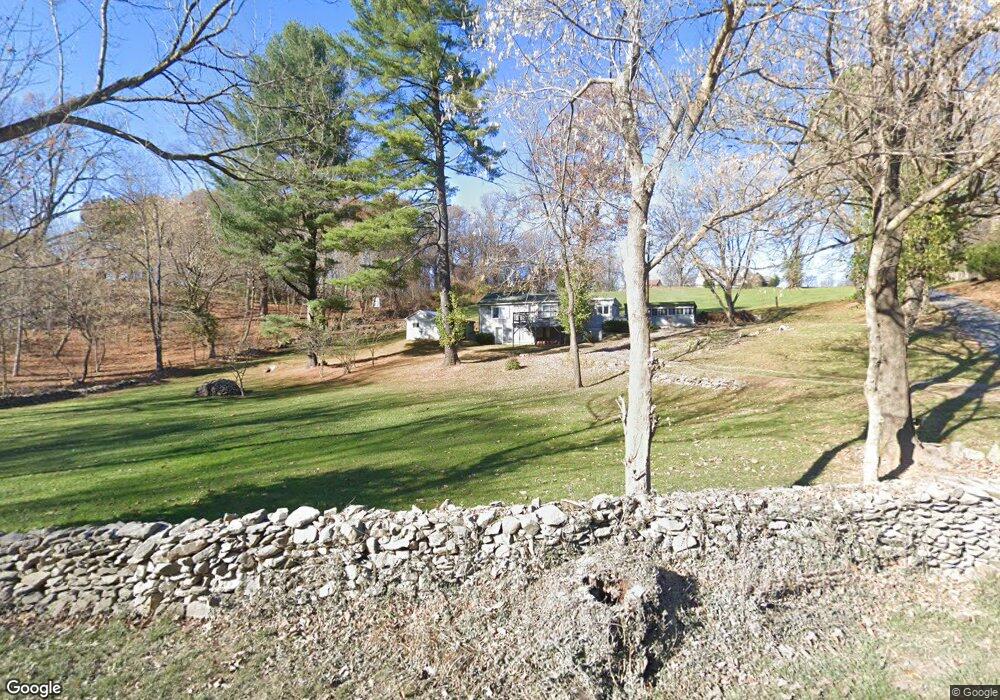
3952 Fiery Run Rd Linden, VA 22642
Estimated Value: $339,000 - $417,000
3
Beds
1
Bath
1,044
Sq Ft
$357/Sq Ft
Est. Value
About This Home
This home is located at 3952 Fiery Run Rd, Linden, VA 22642 and is currently estimated at $373,091, approximately $357 per square foot. 3952 Fiery Run Rd is a home located in Fauquier County with nearby schools including Claude Thompson Elementary School, Marshall Middle School, and Fauquier High School.
Ownership History
Date
Name
Owned For
Owner Type
Purchase Details
Closed on
Feb 20, 2015
Sold by
Faber Christopher G
Bought by
Nelson William H
Current Estimated Value
Home Financials for this Owner
Home Financials are based on the most recent Mortgage that was taken out on this home.
Original Mortgage
$188,491
Outstanding Balance
$143,895
Interest Rate
3.75%
Mortgage Type
FHA
Estimated Equity
$229,196
Purchase Details
Closed on
Dec 12, 2011
Sold by
Clarke John P H
Bought by
Faber Christopher G
Home Financials for this Owner
Home Financials are based on the most recent Mortgage that was taken out on this home.
Original Mortgage
$158,650
Interest Rate
4.01%
Mortgage Type
New Conventional
Purchase Details
Closed on
Jul 9, 2010
Sold by
Us Bank National Asoc
Bought by
Clarke John P H
Purchase Details
Closed on
May 3, 2005
Sold by
Clowe Louise
Bought by
Tolson Thomas
Create a Home Valuation Report for This Property
The Home Valuation Report is an in-depth analysis detailing your home's value as well as a comparison with similar homes in the area
Home Values in the Area
Average Home Value in this Area
Purchase History
| Date | Buyer | Sale Price | Title Company |
|---|---|---|---|
| Nelson William H | $192,000 | -- | |
| Faber Christopher G | $172,000 | -- | |
| Clarke John P H | $78,000 | -- | |
| Tolson Thomas | $125,000 | -- |
Source: Public Records
Mortgage History
| Date | Status | Borrower | Loan Amount |
|---|---|---|---|
| Open | Nelson William H | $188,491 | |
| Previous Owner | Faber Christopher G | $158,650 |
Source: Public Records
Tax History Compared to Growth
Tax History
| Year | Tax Paid | Tax Assessment Tax Assessment Total Assessment is a certain percentage of the fair market value that is determined by local assessors to be the total taxable value of land and additions on the property. | Land | Improvement |
|---|---|---|---|---|
| 2025 | $2,383 | $246,400 | $110,000 | $136,400 |
| 2024 | $2,337 | $246,400 | $110,000 | $136,400 |
| 2023 | $2,239 | $246,400 | $110,000 | $136,400 |
| 2022 | $2,239 | $246,400 | $110,000 | $136,400 |
| 2021 | $1,895 | $189,300 | $95,000 | $94,300 |
| 2020 | $1,895 | $189,300 | $95,000 | $94,300 |
| 2019 | $1,895 | $189,300 | $95,000 | $94,300 |
| 2018 | $1,873 | $189,300 | $95,000 | $94,300 |
| 2016 | $1,687 | $161,100 | $99,000 | $62,100 |
| 2015 | -- | $161,100 | $99,000 | $62,100 |
| 2014 | -- | $161,100 | $99,000 | $62,100 |
Source: Public Records
Map
Nearby Homes
- 0 Fiery Run Rd Unit VAFQ2019678
- 0 Fiery Run Rd Unit VAFQ2015870
- 13138 Mount Paran Church Rd
- 3932 Hidden Valley Ln
- 3998 Hidden Valley Ln
- 4179 Fiery Run Rd
- 4127 Hardscrabble Rd
- 236 Piedmont Orchard Rd
- 189 Piedmont Orchard Rd
- 0 Carolyns Way
- 13057 John Marshall Hwy
- L12 Apple Mountain Lake S
- 0 John Marshall Hwy Unit VAWR2011752
- 0 Old Orchard Rd Unit VAWR2012916
- 4800 Fiery Run Rd
- 47 Newton Dr
- 689 Windy Way
- Lot 5 Deer Trail Rd
- Lot 36 Jonathan Rd
- Lot 13 Jonathan Rd
- 5785 Vine Ln
- 3949 Fiery Run Rd
- 3937 Fiery Run Rd
- 3955 Fiery Run Rd
- 3 Hardscrabble Road A
- 3906 Fiery Run Rd
- 0 Vine Ln Unit FQ8337327
- 3673 Harrels Corner Rd
- 5821 Vine Ln
- 0 Vine Ln Unit 1007028428
- 0 Vine Ln Unit 1007075664
- 0 Vine Ln Unit 1007031842
- 0 Vine Ln Unit 1007012050
- 0 Vine Ln Unit 1006976996
- 0 Vine Ln Unit FQ8179638
- 0 Vine Ln Unit 1002971356
- 3919 Fiery Run Rd
- 3904 Fiery Run Rd
- 3950 Fiery Run Rd
- 3759 Harrels Corner Rd