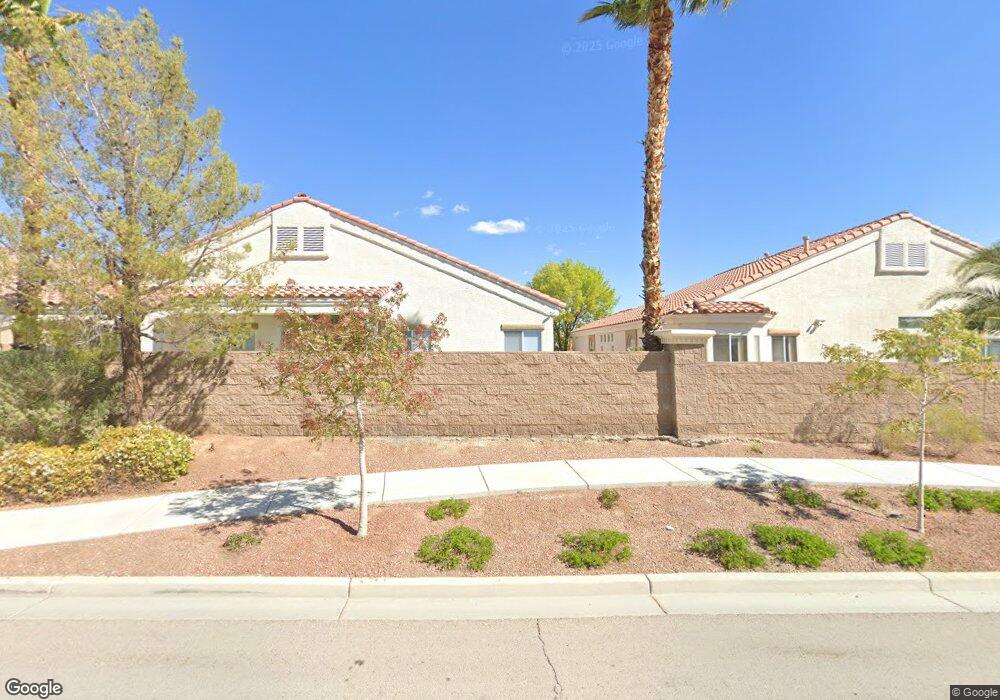
3952 Genoa Dr Las Vegas, NV 89141
Southern Highlands NeighborhoodEstimated Value: $586,000 - $644,000
4
Beds
2
Baths
2,125
Sq Ft
$289/Sq Ft
Est. Value
About This Home
This home is located at 3952 Genoa Dr, Las Vegas, NV 89141 and is currently estimated at $614,255, approximately $289 per square foot. 3952 Genoa Dr is a home located in Clark County with nearby schools including Dennis Ortwein Elementary, Lois & Jerry Tarkanian Middle School, and Desert Oasis High School.
Ownership History
Date
Name
Owned For
Owner Type
Purchase Details
Closed on
Aug 3, 2020
Sold by
Hopkins Sharon and Hopkins Dale Patrick
Bought by
Snyder Derek J and Snyder Rebecca A
Current Estimated Value
Home Financials for this Owner
Home Financials are based on the most recent Mortgage that was taken out on this home.
Original Mortgage
$400,000
Outstanding Balance
$352,312
Interest Rate
3.1%
Mortgage Type
VA
Estimated Equity
$261,943
Purchase Details
Closed on
Dec 9, 2019
Sold by
Laputt Michael T and Laputt Patricia J
Bought by
Hopkins Sharon and Hopkins Dale Patrick
Home Financials for this Owner
Home Financials are based on the most recent Mortgage that was taken out on this home.
Original Mortgage
$270,000
Interest Rate
3.7%
Mortgage Type
New Conventional
Purchase Details
Closed on
Jun 14, 2001
Sold by
Drhi Inc
Bought by
Laputt Michael T and Laputt Patricia J
Home Financials for this Owner
Home Financials are based on the most recent Mortgage that was taken out on this home.
Original Mortgage
$190,600
Interest Rate
7.14%
Create a Home Valuation Report for This Property
The Home Valuation Report is an in-depth analysis detailing your home's value as well as a comparison with similar homes in the area
Home Values in the Area
Average Home Value in this Area
Purchase History
| Date | Buyer | Sale Price | Title Company |
|---|---|---|---|
| Snyder Derek J | $40,000 | First American Title Insu | |
| Hopkins Sharon | $371,000 | First American Title | |
| Laputt Michael T | $200,642 | United Title |
Source: Public Records
Mortgage History
| Date | Status | Borrower | Loan Amount |
|---|---|---|---|
| Open | Snyder Derek J | $400,000 | |
| Previous Owner | Hopkins Sharon | $270,000 | |
| Previous Owner | Laputt Michael T | $190,600 |
Source: Public Records
Tax History
| Year | Tax Paid | Tax Assessment Tax Assessment Total Assessment is a certain percentage of the fair market value that is determined by local assessors to be the total taxable value of land and additions on the property. | Land | Improvement |
|---|---|---|---|---|
| 2026 | $2,151 | $145,362 | $55,650 | $89,712 |
| 2025 | $2,354 | $141,238 | $50,050 | $91,188 |
| 2024 | $1,568 | $141,238 | $50,050 | $91,188 |
| 2023 | $1,568 | $126,872 | $40,950 | $85,922 |
| 2022 | $2,098 | $115,567 | $36,750 | $78,817 |
| 2021 | $2,402 | $108,167 | $33,250 | $74,917 |
| 2020 | $2,329 | $105,436 | $31,150 | $74,286 |
| 2019 | $2,183 | $101,386 | $28,350 | $73,036 |
| 2018 | $2,083 | $94,160 | $23,800 | $70,360 |
| 2017 | $2,757 | $93,996 | $22,750 | $71,246 |
| 2016 | $1,950 | $90,378 | $19,250 | $71,128 |
| 2015 | $1,946 | $69,486 | $14,000 | $55,486 |
| 2014 | -- | $66,415 | $10,500 | $55,915 |
Source: Public Records
Map
Nearby Homes
- 3964 Irvin Ave
- 4167 Bottiglia Ave
- 4039 Zebra Cactus Ave
- 4049 Zebra Cactus Ave
- 10629 Canon Perdido St
- 10540 Canon Perdido St
- 3711 Lodina Ct
- 10740 Tuscan Ct
- 10777 Muscari Way
- 4089 Silver Torch Ave
- 3716 Perugia Ct
- 10884 Pentland Downs St
- 3763 Perugia Ct
- 10417 Candelabra Cactus St
- 10902 Pentland Downs St
- 10852 Avenzano St
- 10922 Fintry Hills St
- 10921 Calcedonian St
- 10596 Refugio St
- 10919 Pentland Downs St
- 3964 Genoa Dr
- 3940 Genoa Dr Unit 1
- 3953 Trapani Place Unit 1
- 3965 Trapani Place
- 3941 Trapani Place
- 3976 Genoa Dr Unit na
- 3976 Genoa Dr
- 3928 Genoa Dr Unit 1
- 3957 Genoa Dr
- 3977 Trapani Place
- 3929 Trapani Place
- 3969 Genoa Dr Unit 1
- 3933 Genoa Dr
- 3916 Genoa Dr Unit 1
- 3988 Genoa Dr Unit 1
- 3981 Genoa Dr
- 3989 Trapani Place
- 3921 Genoa Dr
- 3996 Genoa Dr
Your Personal Tour Guide
Ask me questions while you tour the home.