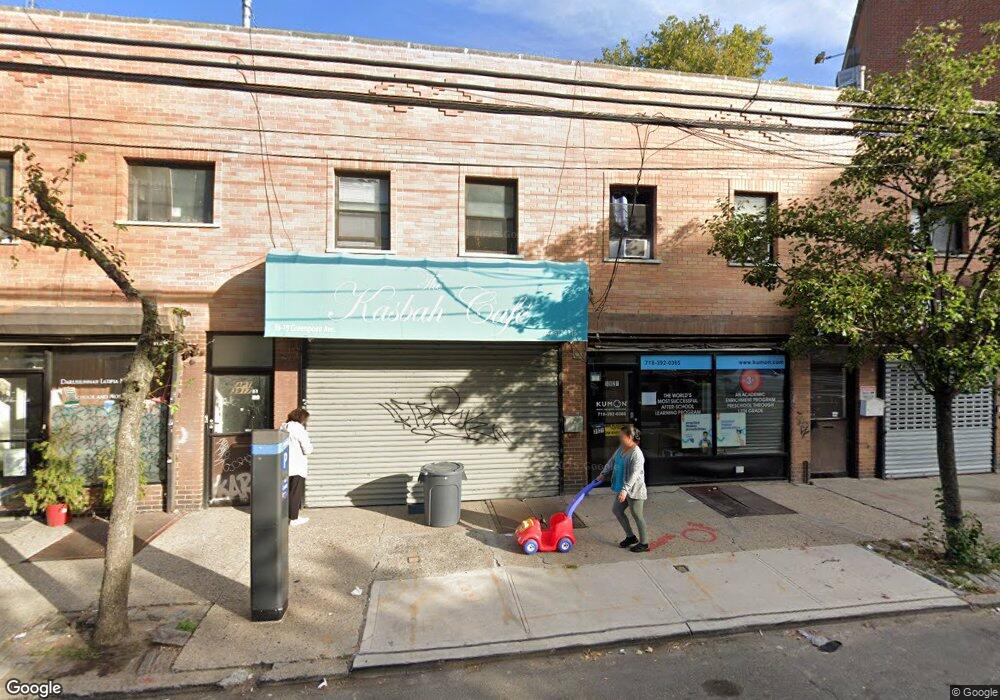
3952 Greenpoint Ave Long Island City, NY 11104
Sunnyside NeighborhoodEstimated Value: $4,188,752
--
Bed
--
Bath
6,700
Sq Ft
$625/Sq Ft
Est. Value
About This Home
This home is located at 3952 Greenpoint Ave, Long Island City, NY 11104 and is currently estimated at $4,188,752, approximately $625 per square foot. 3952 Greenpoint Ave is a home located in Queens County with nearby schools including P.S. 199 Maurice A Fitzgerald, Long Island City High School, and Most Precious Blood Roman Catholic Church.
Ownership History
Date
Name
Owned For
Owner Type
Purchase Details
Closed on
Nov 21, 2016
Sold by
39-21 Property Inc
Bought by
Sunnyside Gp Inc
Current Estimated Value
Purchase Details
Closed on
Jun 1, 2016
Sold by
Of The Kil Ja Kim Family Trust and Tae Sup Kim As Trustee
Bought by
39-21 Property Inc
Home Financials for this Owner
Home Financials are based on the most recent Mortgage that was taken out on this home.
Original Mortgage
$1,210,779
Interest Rate
3.64%
Mortgage Type
Commercial
Purchase Details
Closed on
Nov 25, 2015
Sold by
Kim Kil Ja
Bought by
Tae Sup Kim As Trustee and The Kil Ja Kim Family Trust
Purchase Details
Closed on
Apr 16, 2003
Sold by
Jj & Ss Corp
Bought by
Kim Kil Ja
Purchase Details
Closed on
May 1, 1996
Sold by
Escort Property Corp
Bought by
Jj & Ss Corp
Home Financials for this Owner
Home Financials are based on the most recent Mortgage that was taken out on this home.
Original Mortgage
$350,000
Interest Rate
7.97%
Mortgage Type
Commercial
Create a Home Valuation Report for This Property
The Home Valuation Report is an in-depth analysis detailing your home's value as well as a comparison with similar homes in the area
Home Values in the Area
Average Home Value in this Area
Purchase History
| Date | Buyer | Sale Price | Title Company |
|---|---|---|---|
| Sunnyside Gp Inc | $3,230,000 | -- | |
| Sunnyside Gp Inc | $3,230,000 | -- | |
| 39-21 Property Inc | $2,800,000 | -- | |
| 39-21 Property Inc | $2,800,000 | -- | |
| Tae Sup Kim As Trustee | -- | -- | |
| Tae Sup Kim As Trustee | -- | -- | |
| Kim Kil Ja | $938,000 | -- | |
| Kim Kil Ja | $938,000 | -- | |
| Jj & Ss Corp | $600,000 | -- | |
| Jj & Ss Corp | $600,000 | -- |
Source: Public Records
Mortgage History
| Date | Status | Borrower | Loan Amount |
|---|---|---|---|
| Previous Owner | 39-21 Property Inc | $1,210,779 | |
| Previous Owner | Jj & Ss Corp | $350,000 | |
| Closed | Kim Kil Ja | $0 |
Source: Public Records
Tax History Compared to Growth
Tax History
| Year | Tax Paid | Tax Assessment Tax Assessment Total Assessment is a certain percentage of the fair market value that is determined by local assessors to be the total taxable value of land and additions on the property. | Land | Improvement |
|---|---|---|---|---|
| 2025 | $74,556 | $644,060 | $13,179 | $630,881 |
| 2024 | $74,556 | $596,353 | $13,299 | $583,054 |
| 2023 | $72,949 | $583,501 | $13,721 | $569,780 |
| 2022 | $70,702 | $736,650 | $17,100 | $719,550 |
| 2021 | $65,636 | $589,500 | $17,100 | $572,400 |
| 2020 | $61,795 | $647,100 | $17,100 | $630,000 |
| 2019 | $57,855 | $587,700 | $17,100 | $570,600 |
| 2018 | $57,089 | $448,847 | $11,714 | $437,133 |
| 2017 | $56,538 | $444,515 | $12,348 | $432,167 |
| 2016 | $53,062 | $444,515 | $12,348 | $432,167 |
| 2015 | $22,966 | $381,101 | $12,538 | $368,563 |
| 2014 | $22,966 | $352,872 | $13,725 | $339,147 |
Source: Public Records
Map
Nearby Homes
- 5024 39th Place
- 50-21 39th Place Unit 2C
- 50-21 39th Place Unit 6D
- 0 39th St
- 50-22 40th St Unit 3E
- 50-22 40th St Unit 5A
- 50-35 38th St
- 3617 Greenpoint Ave
- 48-12 37th St
- 50-43 39th St
- 50-29 39th Place
- 4827 40th St
- 48-21 40th St Unit 2C
- 48-21 40th St Unit 5H
- 50-21 40th St
- 5054 39th Place
- 47-25 40th St Unit 2C
- 48-23 42nd St Unit 1 J
- 48-17 42nd St Unit 2C
- 48-17 42nd St Unit 7B
- 39-17 Greenpoint Ave Unit 2L
- 39-17 Greenpoint Ave Unit 2R
- 39-17 Greenpoint Ave
- 39-15 Greenpoint Ave
- 39-19 Greenpoint Ave
- 48-15 Greenpoint Ave
- 48-11 Greenpoint Ave
- 3921 Greenpoint Ave
- 39-21 Greenpoint Ave
- 4825 39th St
- 4823 39th St
- 4821 39th St
- 48-21 39th St Unit 2R
- 48-21 39th St Unit 2FL
- 4821 39th St Unit BASEMT
- 3920 Greenpoint Ave
- 4819 39th St
- 4838 39th St
- 48-19 39th St
- 4840 39th St