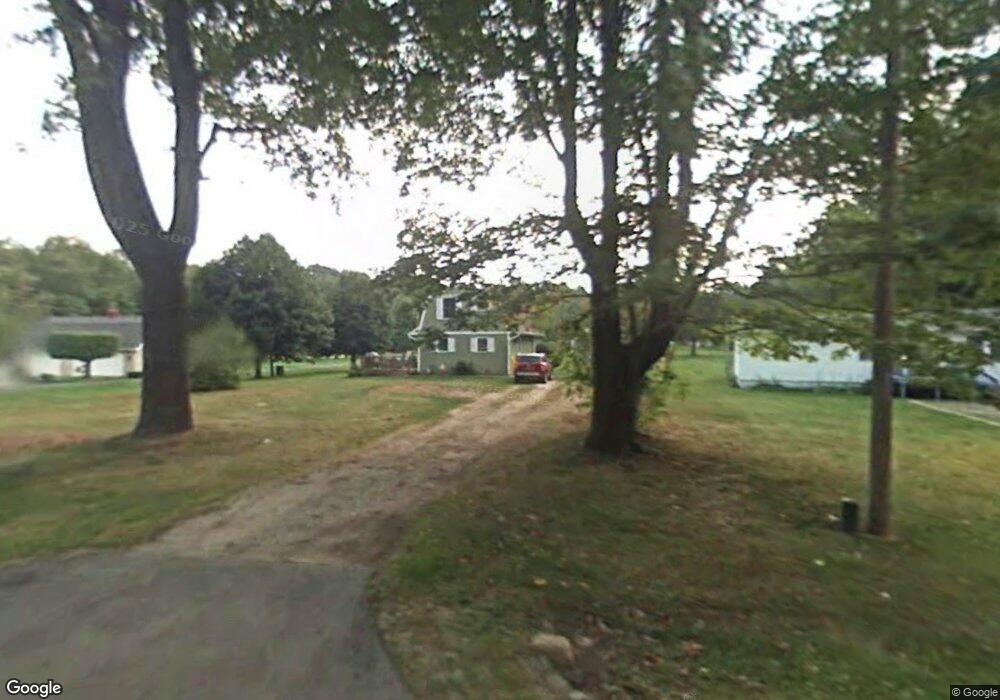
3952 Lake Rd Conneaut, OH 44030
Kingsville NeighborhoodEstimated Value: $165,000 - $181,000
1
Bed
2
Baths
960
Sq Ft
$183/Sq Ft
Est. Value
About This Home
This home is located at 3952 Lake Rd, Conneaut, OH 44030 and is currently estimated at $175,716, approximately $183 per square foot. 3952 Lake Rd is a home located in Ashtabula County with nearby schools including Kingsville Elementary School, Ridgeview Elementary School, and Wallace H. Braden Junior High School.
Ownership History
Date
Name
Owned For
Owner Type
Purchase Details
Closed on
Jul 11, 2016
Sold by
Flowers Ronald M and Flowers Diane L
Bought by
Flowers Ronald M and Flowers Diane L
Current Estimated Value
Purchase Details
Closed on
Jun 25, 2010
Sold by
Salvaterra Mike A
Bought by
Waggel James A and Waggel Judy K
Purchase Details
Closed on
May 31, 2007
Sold by
Molnar Andrew J and Molnar Virginia
Bought by
Salvaterra Mark A
Home Financials for this Owner
Home Financials are based on the most recent Mortgage that was taken out on this home.
Original Mortgage
$55,500
Interest Rate
6.21%
Mortgage Type
Unknown
Purchase Details
Closed on
Jan 11, 2006
Sold by
Molnar Andrew J
Bought by
Molnar Andrew J and Molnar Virginia
Home Financials for this Owner
Home Financials are based on the most recent Mortgage that was taken out on this home.
Original Mortgage
$48,000
Interest Rate
10.25%
Mortgage Type
New Conventional
Purchase Details
Closed on
May 5, 2005
Sold by
Estate Of Margaret E Molnar
Bought by
Molnar Andrew J
Create a Home Valuation Report for This Property
The Home Valuation Report is an in-depth analysis detailing your home's value as well as a comparison with similar homes in the area
Home Values in the Area
Average Home Value in this Area
Purchase History
| Date | Buyer | Sale Price | Title Company |
|---|---|---|---|
| Flowers Ronald M | -- | None Available | |
| Waggel James A | $67,000 | Chicago Title | |
| Salvaterra Mark A | $66,000 | Chicago Title | |
| Molnar Andrew J | -- | None Available | |
| Molnar Andrew J | -- | -- |
Source: Public Records
Mortgage History
| Date | Status | Borrower | Loan Amount |
|---|---|---|---|
| Previous Owner | Salvaterra Mark A | $55,500 | |
| Previous Owner | Molnar Andrew J | $48,000 |
Source: Public Records
Tax History
| Year | Tax Paid | Tax Assessment Tax Assessment Total Assessment is a certain percentage of the fair market value that is determined by local assessors to be the total taxable value of land and additions on the property. | Land | Improvement |
|---|---|---|---|---|
| 2024 | $2,555 | $35,920 | $8,650 | $27,270 |
| 2023 | $1,274 | $35,920 | $8,650 | $27,270 |
| 2022 | $1,287 | $32,590 | $6,650 | $25,940 |
| 2021 | $1,289 | $32,590 | $6,650 | $25,940 |
| 2020 | $1,303 | $32,590 | $6,650 | $25,940 |
| 2019 | $1,364 | $32,590 | $5,710 | $26,880 |
| 2018 | $1,314 | $32,590 | $5,710 | $26,880 |
| 2017 | $1,238 | $32,590 | $5,710 | $26,880 |
| 2016 | $1,163 | $28,600 | $5,010 | $23,590 |
| 2015 | $1,162 | $28,600 | $5,010 | $23,590 |
| 2014 | $1,126 | $28,600 | $5,010 | $23,590 |
| 2013 | $790 | $20,240 | $5,360 | $14,880 |
Source: Public Records
Map
Nearby Homes
- 7296 Poore Rd
- 3881 E Center St
- 7630 Darling Ave
- 7527 Tamkrist Trail
- 3339 Lake Rd
- 7435 Glenwood Rd
- 7032 Reed Rd
- 7002 Reed Rd
- 255 N Amboy Rd
- 1381 Robb Rd
- 2940 Corries Way
- 19 Burrington Heights
- 3241 S Forest Dr
- 275 Creek Rd
- 436 Keefus Rd
- 0 Creek Rd Unit 5172426
- 202 W Main Rd Unit 132
- 210 W Main Rd
- 2663 Lake Rd
- 220 Daniels Ave
- 3942 Lake Rd
- 3942 Lake State Rd 531 Rd
- 3960 Lake Rd
- 7755 Martin Dr
- 3979 Lake State Rd 531 Rd
- 7763 Martin Dr
- 3979 Lake Rd
- 1756 Lake Rd
- 3989 Lake Rd
- 7725 Martin Dr
- 7801 Hillcrest Dr
- 7805 Cleveland Dr
- 3999 Lake Rd
- 7821 Cleveland Dr
- 4001 Lake Rd
- 4001 Lake Rd
- 7824 Cleveland Dr
- 7828 Cleveland Dr
- 3978 Valley Brook Dr
- 3960 Valley Brook Dr
Your Personal Tour Guide
Ask me questions while you tour the home.